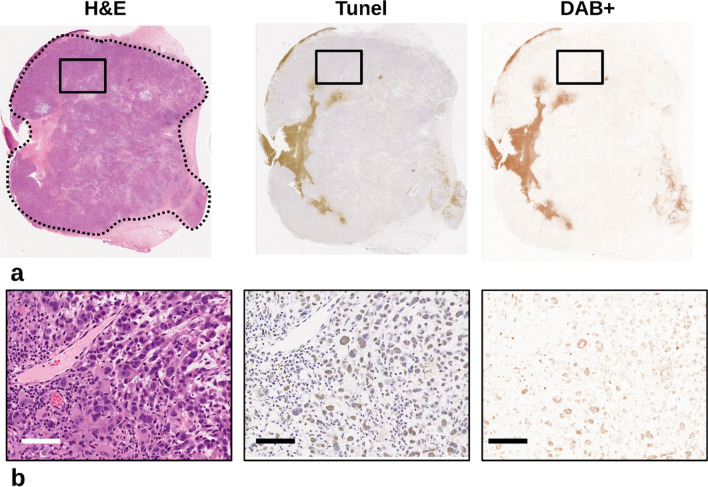
Figure 6.
(a) Light microscopy of whole mount slides displaying H&E, TUNEL, and the DAB + channel respectively. Regions of interest were drawn (dashed curve) on H&E slides avoiding skin and muscle tissue. Color deconvolution separated the TUNEL stains into channels where the DAB + channel was isolated, and the percent positive staining can be calculated as the ratio of included pixels divided by the number of pixels in the ROI. (b) Magnified views (25X; 0.4 × 0.4 µm) of the highlighted regions (black box). Color deconvolution shows good agreement with the brown positive stain in TUNEL stain and absence of background stain. Scale bar represents 160 µm.

