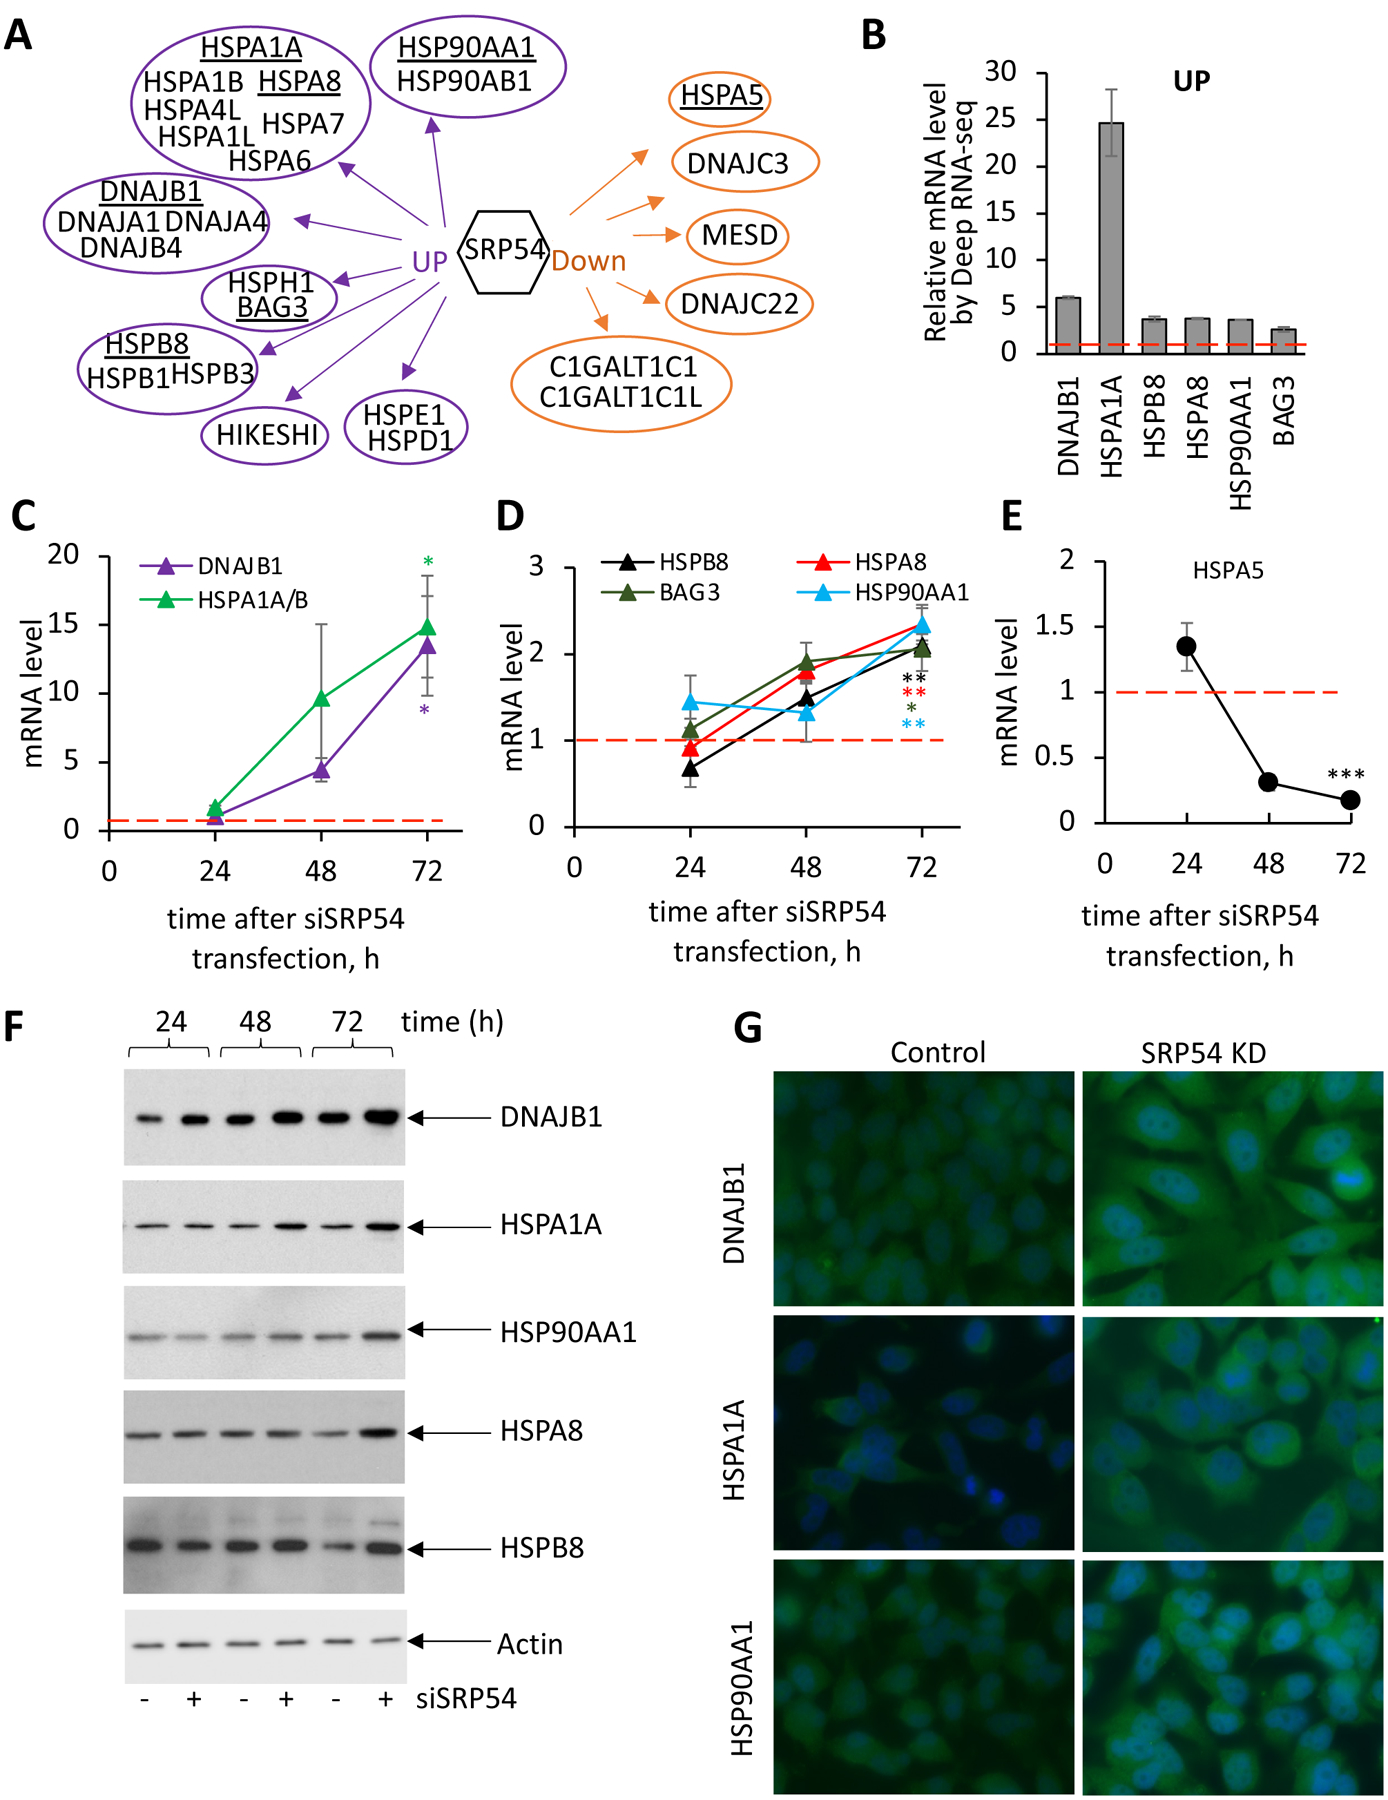
Figure 5. Upregulation of chaperones (heat shock proteins, HSPs) in SRP54 depleted cells.

(A) Schematic presentation of heat shock proteins from different families that are affected in SRP54 knockdown cells as determined by Deep RNA-seq (see also Supplementary File 6). 21 upregulated and 6 downregulated HSPs grouped by families are shown. Underlined chaperones/HSPs were chosen for further analysis.
(B) Relative mRNA levels of selected HSPs determined by Deep RNA-seq analysis. mRNA level was calculated as a ratio between transcripts counts in SRP54 knockdown and control cells. Red dash line presents the value in control cells.
(C) mRNA levels for chaperones DNAJB1 and HSPA1A/B at different time points after siSRP54 transfection were evaluated by RT-qPCR in independent from the Deep RNA-seq experiments at 24, 48 and 72 hours-time points after siRNA specific to SRP54 (siSRP54) transfection. Red dash line shows corresponding mRNA levels in control cells. Error bars are standard errors (n=3). Two-tailed unpaired t test was applied for evaluating statistical significance at the 72 hours- time point. P-values are shown in the corresponding colors: *, p < 0.05.
(D) mRNA levels of HSPB8, HSPA8, BAG3, and HSP90AA1 in SRP54 depleted cells analyzed as described for (C). Red dash line shows corresponding mRNA levels in control cells. Error bars are standard errors (n=3). Two-tailed unpaired t test was applied for evaluating statistical significance at the 72 hours- time point. P-values are shown in the corresponding colors: *, p < 0.05; **, p < 0.01.
(E) mRNA levels of HSPA5 in SRP54 depleted cells analyzed as described for (C). Red dash line shows corresponding mRNA levels in control cells. Error bars are standard errors (n=3). Two-tailed unpaired t test was applied for evaluating statistical significance at the 72 hours- time point. P-values are shown in the corresponding colors: ***; p < 0.001.
(F) Western blot assay of the chaperones/HSPs DNAJB1, HSPA1A, HSP90AA1, HSPA8, and HSPB8 in control (−) and siSRP54 treated cells (+) as indicated. Actin was used as loading control.
(G) Immunostaining of HeLa Tet-ON control (left images) and SRP54 KD (right images) cells with antibodies against DNAJB1 (top), HSPA1A (middle), and HSP90AA1 (bottom). Cells were stained at 48 hours after transfection.
