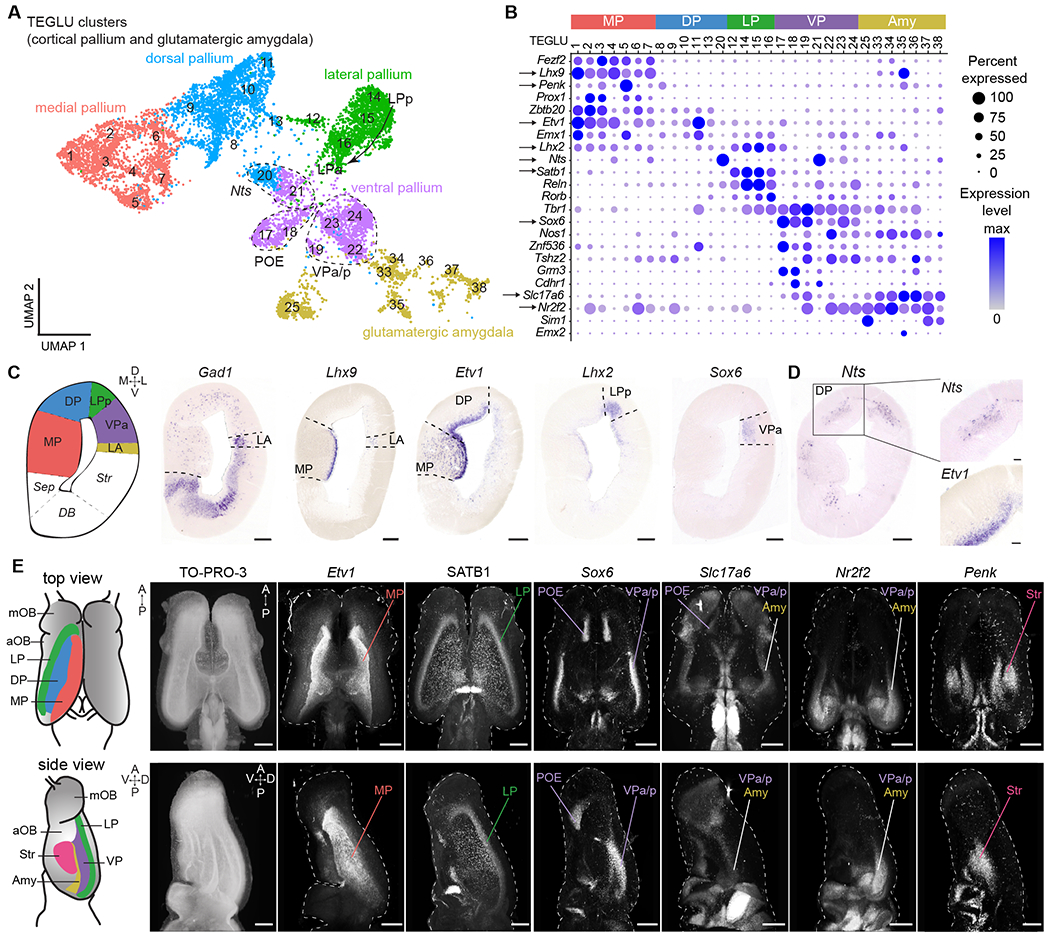
Fig. 2. Spatial mapping of pallial neurons in Pleurodeles.

(A) UMAP plot of clusters from cortical pallium and amygdala, annotated by the inferred pallial region. (B) DotPlot showing the expression of key marker genes defining distinct pallial regions. Arrows: genes shown in C-E. (C) Left to right: schematic of a coronal section at mid-telencephalic level, expression of Gad1, marker of the subpallium, and of transcription factors labeling distinct pallial regions along the mediolateral axis. Scale bars: 200 um. (D) Expression of Nts and Etv1 in layers, boxed areas indicate magnifications on the right. Scale bars in right panels: 50 um. (E) Left: schematics of dorsal and lateral surfaces of the salamander telencephalon. Right: dorsal and lateral views of whole-mount immunohistochemistry or HCR stainings for telencephalic markers. Panels show maximum intensity projections of brains after clearing and volumetric light-sheet imaging. Scale bars: 500 um. See methods for specifics on SATB1 antibody. For full list of abbreviations, see Fig. S1; Amy, amygdala; TEGLU, telencephalic glutamatergic.
