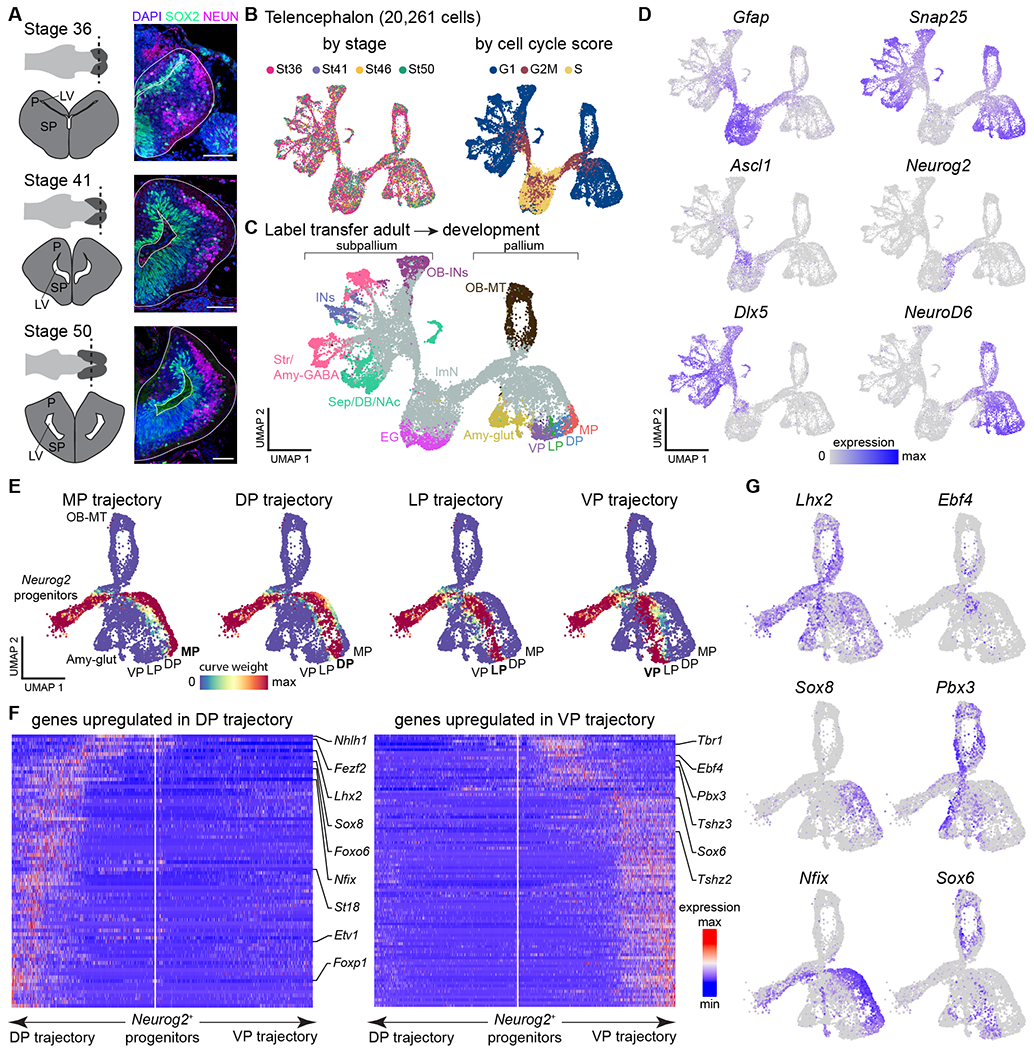
Fig. 3. Developmental trajectories in the Pleurodeles telencephalon.

(A) Overview of telencephalic development in Pleurodeles. Right: coronal sections through the telencephalon showing SOX2+ radial glia and interneurons, and NEUN+ differentiated neurons. Scale bars: 100 um. (B) UMAP plots of 20,261 telencephalic cells colored by developmental stage (left) and cell cycle score (right). (C) UMAP plot of the developing telencephalon, colored according to cell classes after label transfer from the adult dataset. (D) UMAP plots colored by the expression of Gfap (radial glia), Snap25 (differentiated neurons), Ascl1 and Neurog2 (committed subpallial and pallial progenitors), and Dlx5 and NeuroD6 (postmitotic subpallial and pallial neurons). (E) UMAP plots showing the assignment of cells to each of the trajectories based on curve weights, which represent the likelihood that a cell belongs to a given principle curve calculated by Slingshot. (F) Heatmaps of genes differentially expressed along the trajectories of the dorsal and ventral pallium, with transcription factors highlighted on the side. White line in the middle of each panel indicates the position of the Neurog2+ progenitors and arrows to the left and right represent the two trajectories. Gene expression levels for each gene are scaled by root mean square ranging from −2 to 6. (G) UMAP plots showing pallial single cells color-coded by expression of transcription factors upregulated in the dorsal (left) or ventral (right) trajectory.
Abbreviations: see Figs. S1, S3; EG, ependymoglia; ImN, immature neurons; LV, lateral ventricle; OB-MT, olfactory bulb mitral and tufted cells; P, pallium; SP, subpallium.
