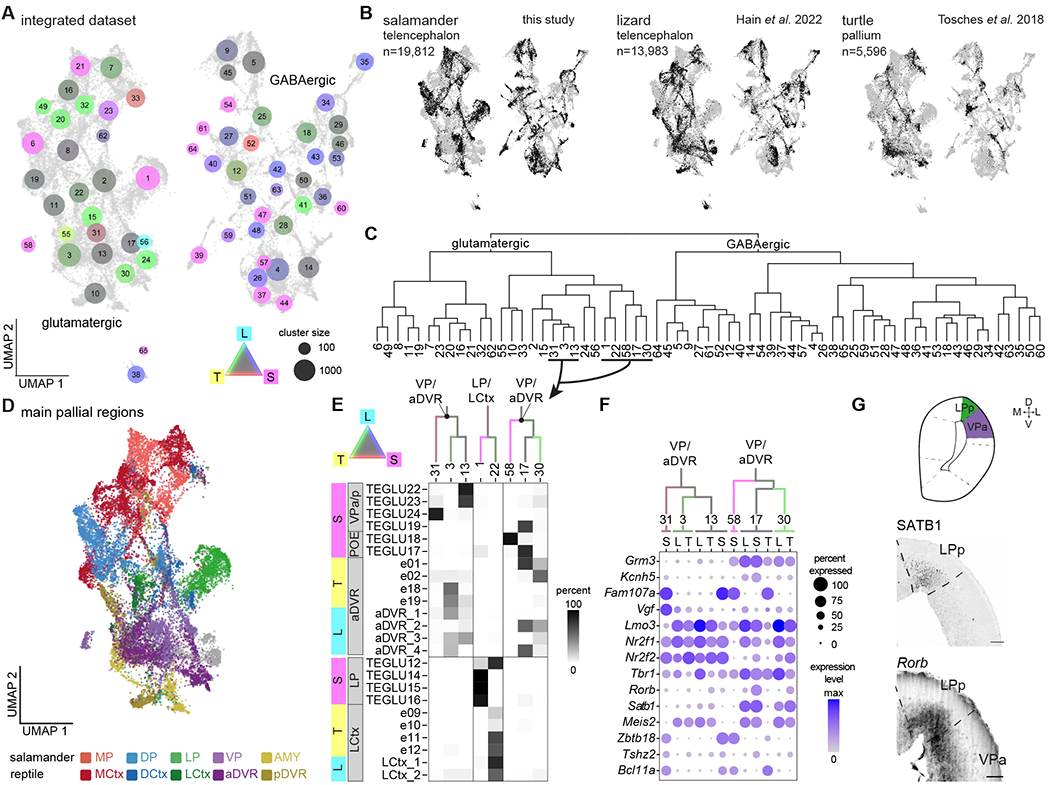
Fig. 4. Salamander and reptile telencephalon cross-species comparison.

(A) UMAP plot after integration of scRNAseq data from the salamander and lizard telencephalon, and from the turtle pallium. Dot colors indicate species mixture in each integrated cluster (gray represents equal proportion of cells from each species). Dot size indicates the number of cells in each cluster. (B) UMAP plots of the integrated dataset showing cells from each species highlighted in black. (C) Hierarchical clustering of average expression profiles of the integrated clusters shown in (A). (D) UMAP plot of the glutamatergic clusters from the integrated dataset, colored by pallial region. (E) Top: ventrolateral portion of the dendrogram in C, with branches colored by species mixture. Bottom: percentage of cells from the original species-specific clusters (rows) in the integrated clusters (columns). (F) DotPlot showing the expression of molecular markers in aDVR or VP in the integrated clusters, with cells from each integrated cluster split by species (L, lizard; S, salamander; T, turtle). (G) Top: schematic of a coronal section at mid-telencephalic level in the Pleurodeles brain. Bottom: presence of SATB1 and expression of Rorb in the salamander lateral and ventral pallium. Scale bars: 100um.
