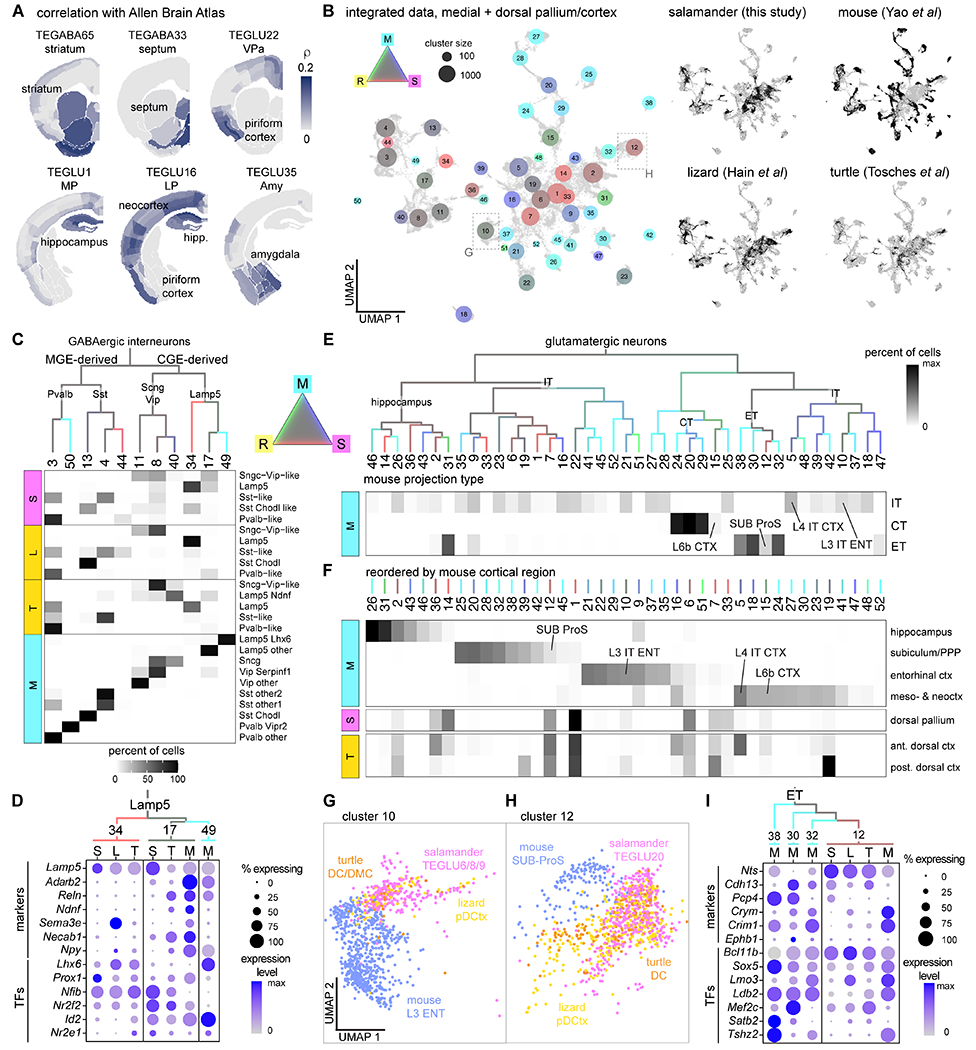
Fig. 5. Salamander, reptile and mouse cross-species comparison.

(A) Correlations of the transcriptome of selected Pleurodeles clusters with in situ hybridization data from the Allen Adult Mouse Brain Atlas. (B) Integration of scRNAseq data from the salamander medial and dorsal pallium, the turtle and lizard (“reptile”) medial and dorsal cortex, and the mouse hippocampus and cortex. Left: UMAP of the integrated data with dots colored by species mixture, dot size indicates cluster size. Right: UMAP plots of the integrated dataset showing cells from each species highlighted in black. (C) Top: Hierarchical clustering of average expression profiles of integrated GABAergic clusters, branches colored by species mixture (gray represents equal proportion of cells from each species). Bottom: percentage of cells from the original species-specific clusters (rows) in the integrated clusters (columns). (D) DotPlot showing expression of differentiation markers and of transcription factors (TFs) in Lamp5 interneurons (integrated clusters 34, 17, and 49). Cells from each integrated cluster split by species (L, lizard; M, mouse; S, salamander; T, turtle). (E) Top: Hierarchical clustering of average expression profiles of integrated glutamatergic clusters, branches colored by species mixture. Bottom: percentage of mouse cells in each integrated cluster (columns); mouse cells grouped by projection identity (rows). Integrated clusters including selected mouse neuron types are highlighted (ENT, entorhinal cortex; L4 IT CTX, thalamorecipient L4 neurons; SUB, subiculum). (F) Top: percentage of mouse cells in each integrated cluster (columns); mouse cells grouped by cortical area (rows), columns reordered by cortical area. Bottom: percentage of salamander DP cells and turtle dorsal cortex cells (rows) in each integrated cluster (columns). (G-H) Close-up on part of the UMAP in (B), showing cells in cluster 10 (G) or cluster 12 (H) colored by species. (I) DotPlot showing expression of differentiation markers and transcription factors (TFs) in integrated clusters 12, 38, 30, and 32, split by species.
