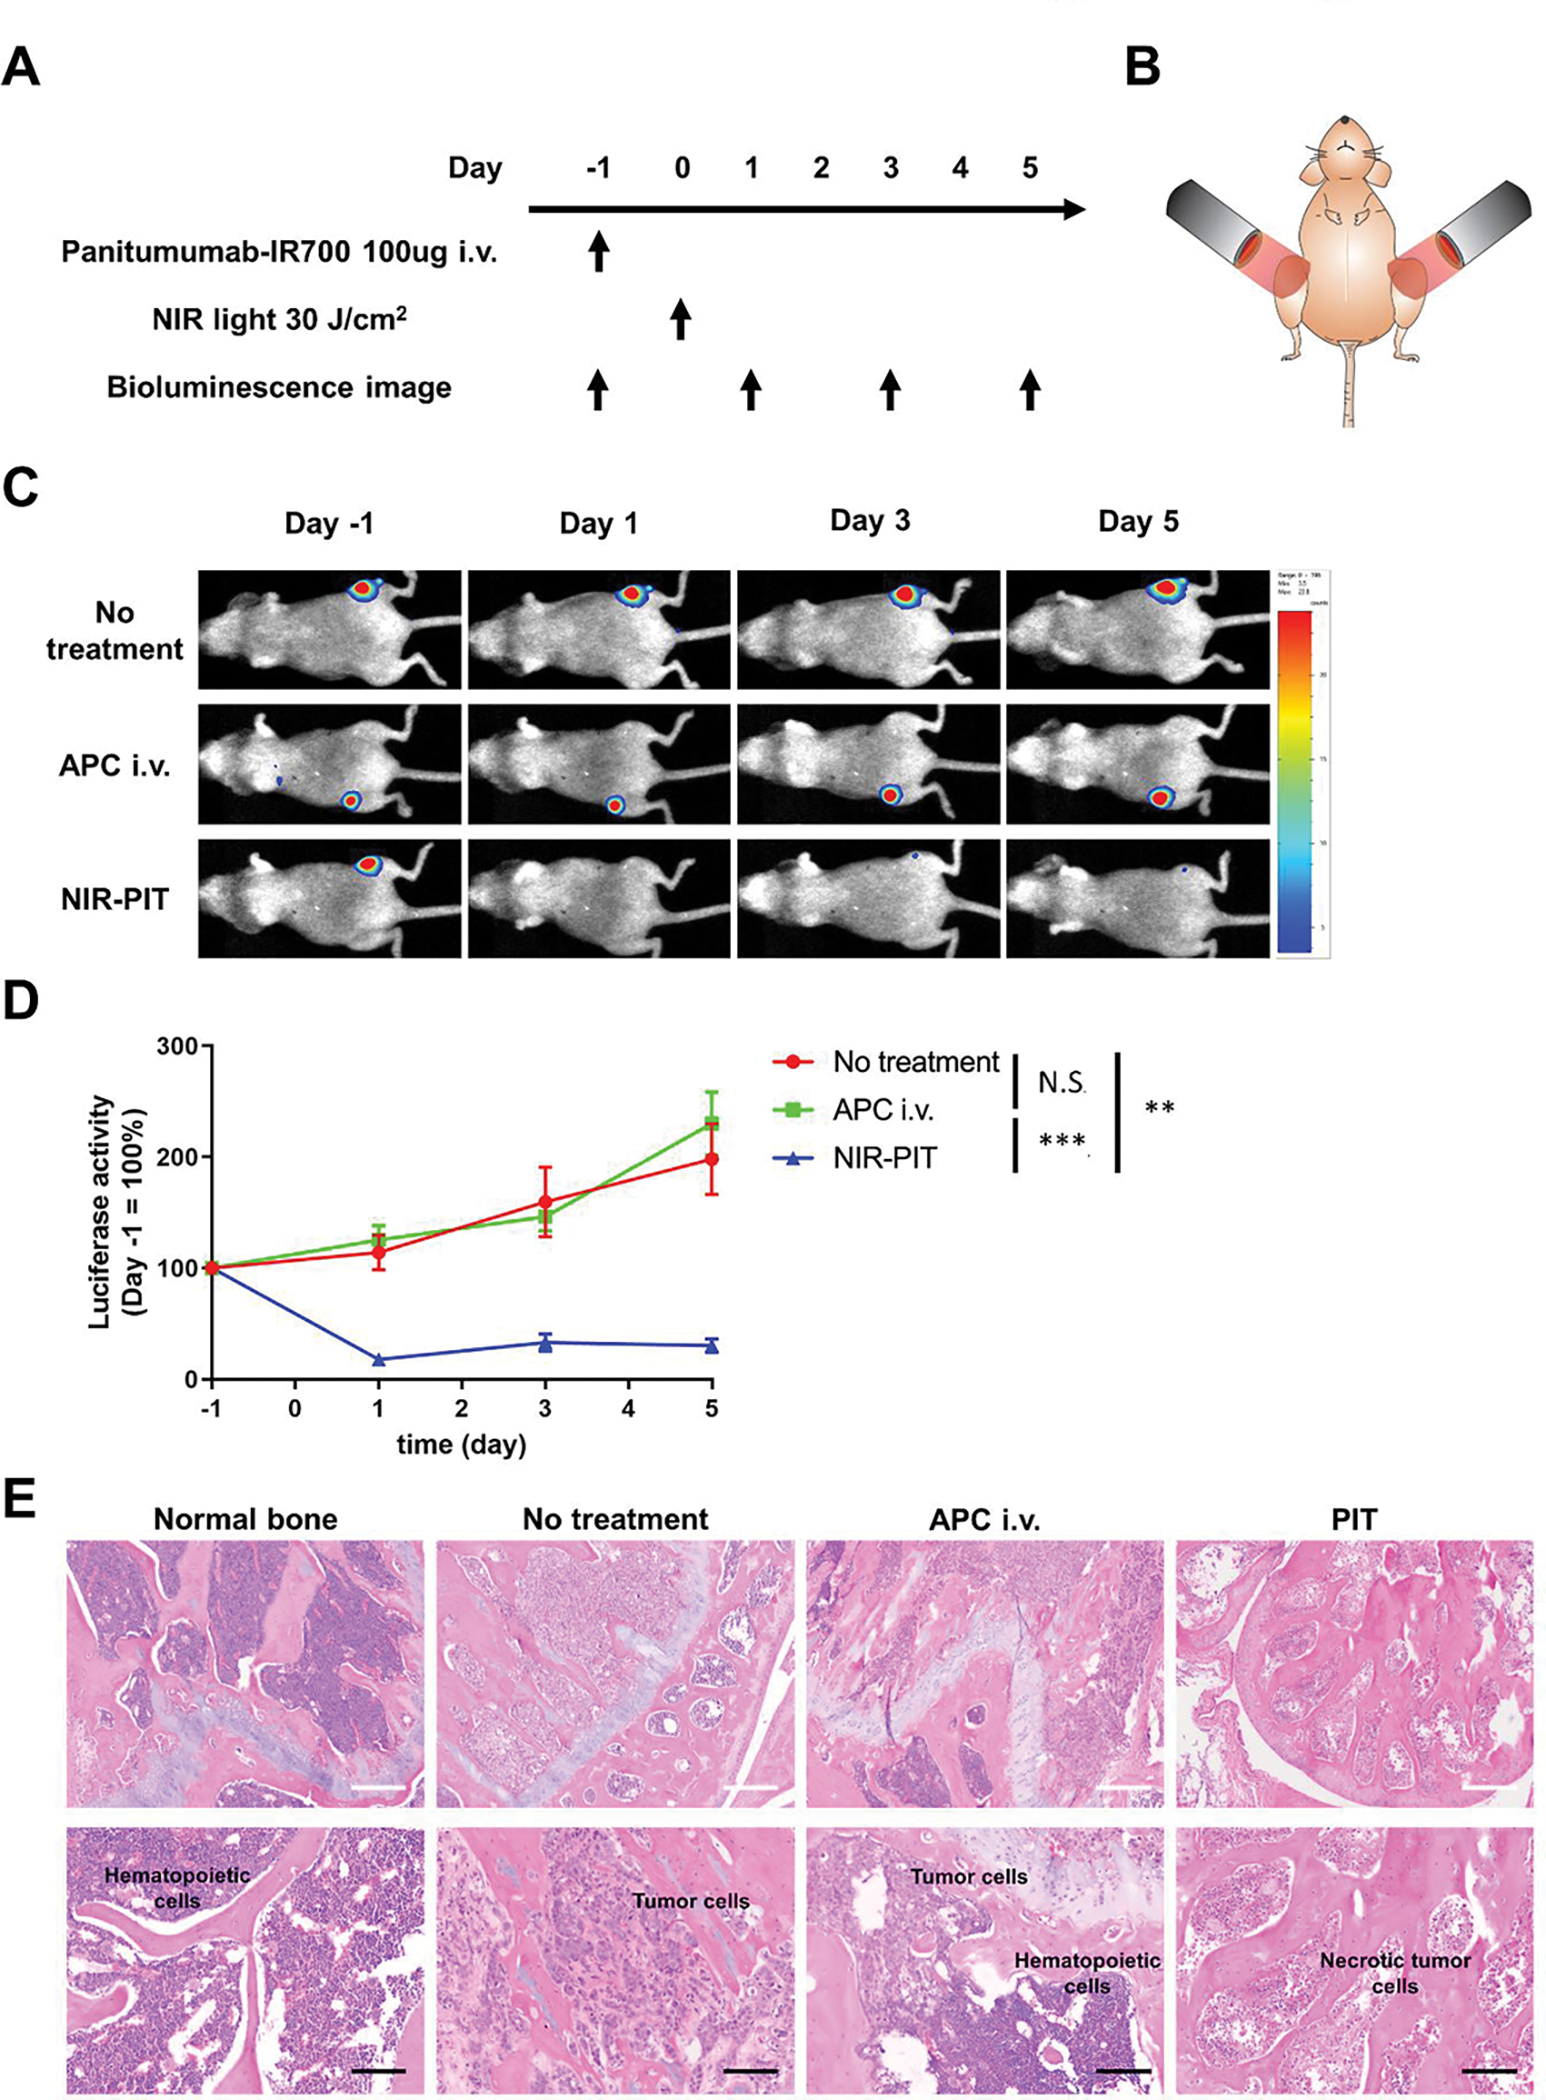
Figure 2. Therapeutic effect of NIR-PIT for naturally grown bone metastasis.

(A) Treatment protocol. Bioluminescence images were acquired at each time point as indicated. (B) Schema of NIR light exposure. NIR light was irradiated around the knee of the mouse. (C) Representative bioluminescence images of mice with bone metastases from each group. (D) Quantitative assessment of luciferase activity (values before treatment were set to 100%; n = 7–8 per group; two-way repeated measures ANOVA followed by Tukey’s multiple comparison test; **p < 0.01, ***p < 0.001; N.S., not significant). (E) Hematoxylin and eosin staining of mouse hind leg bone specimens excised 1 day after NIR-PIT (White scale bars, 100 μm; black scale bars, 50 μm). Necrotic foci which are shown in the image with NIR-PIT are present in all specimens of the treated group (n=3), yet are not shown in any control group (n=3). (p<0.05)
