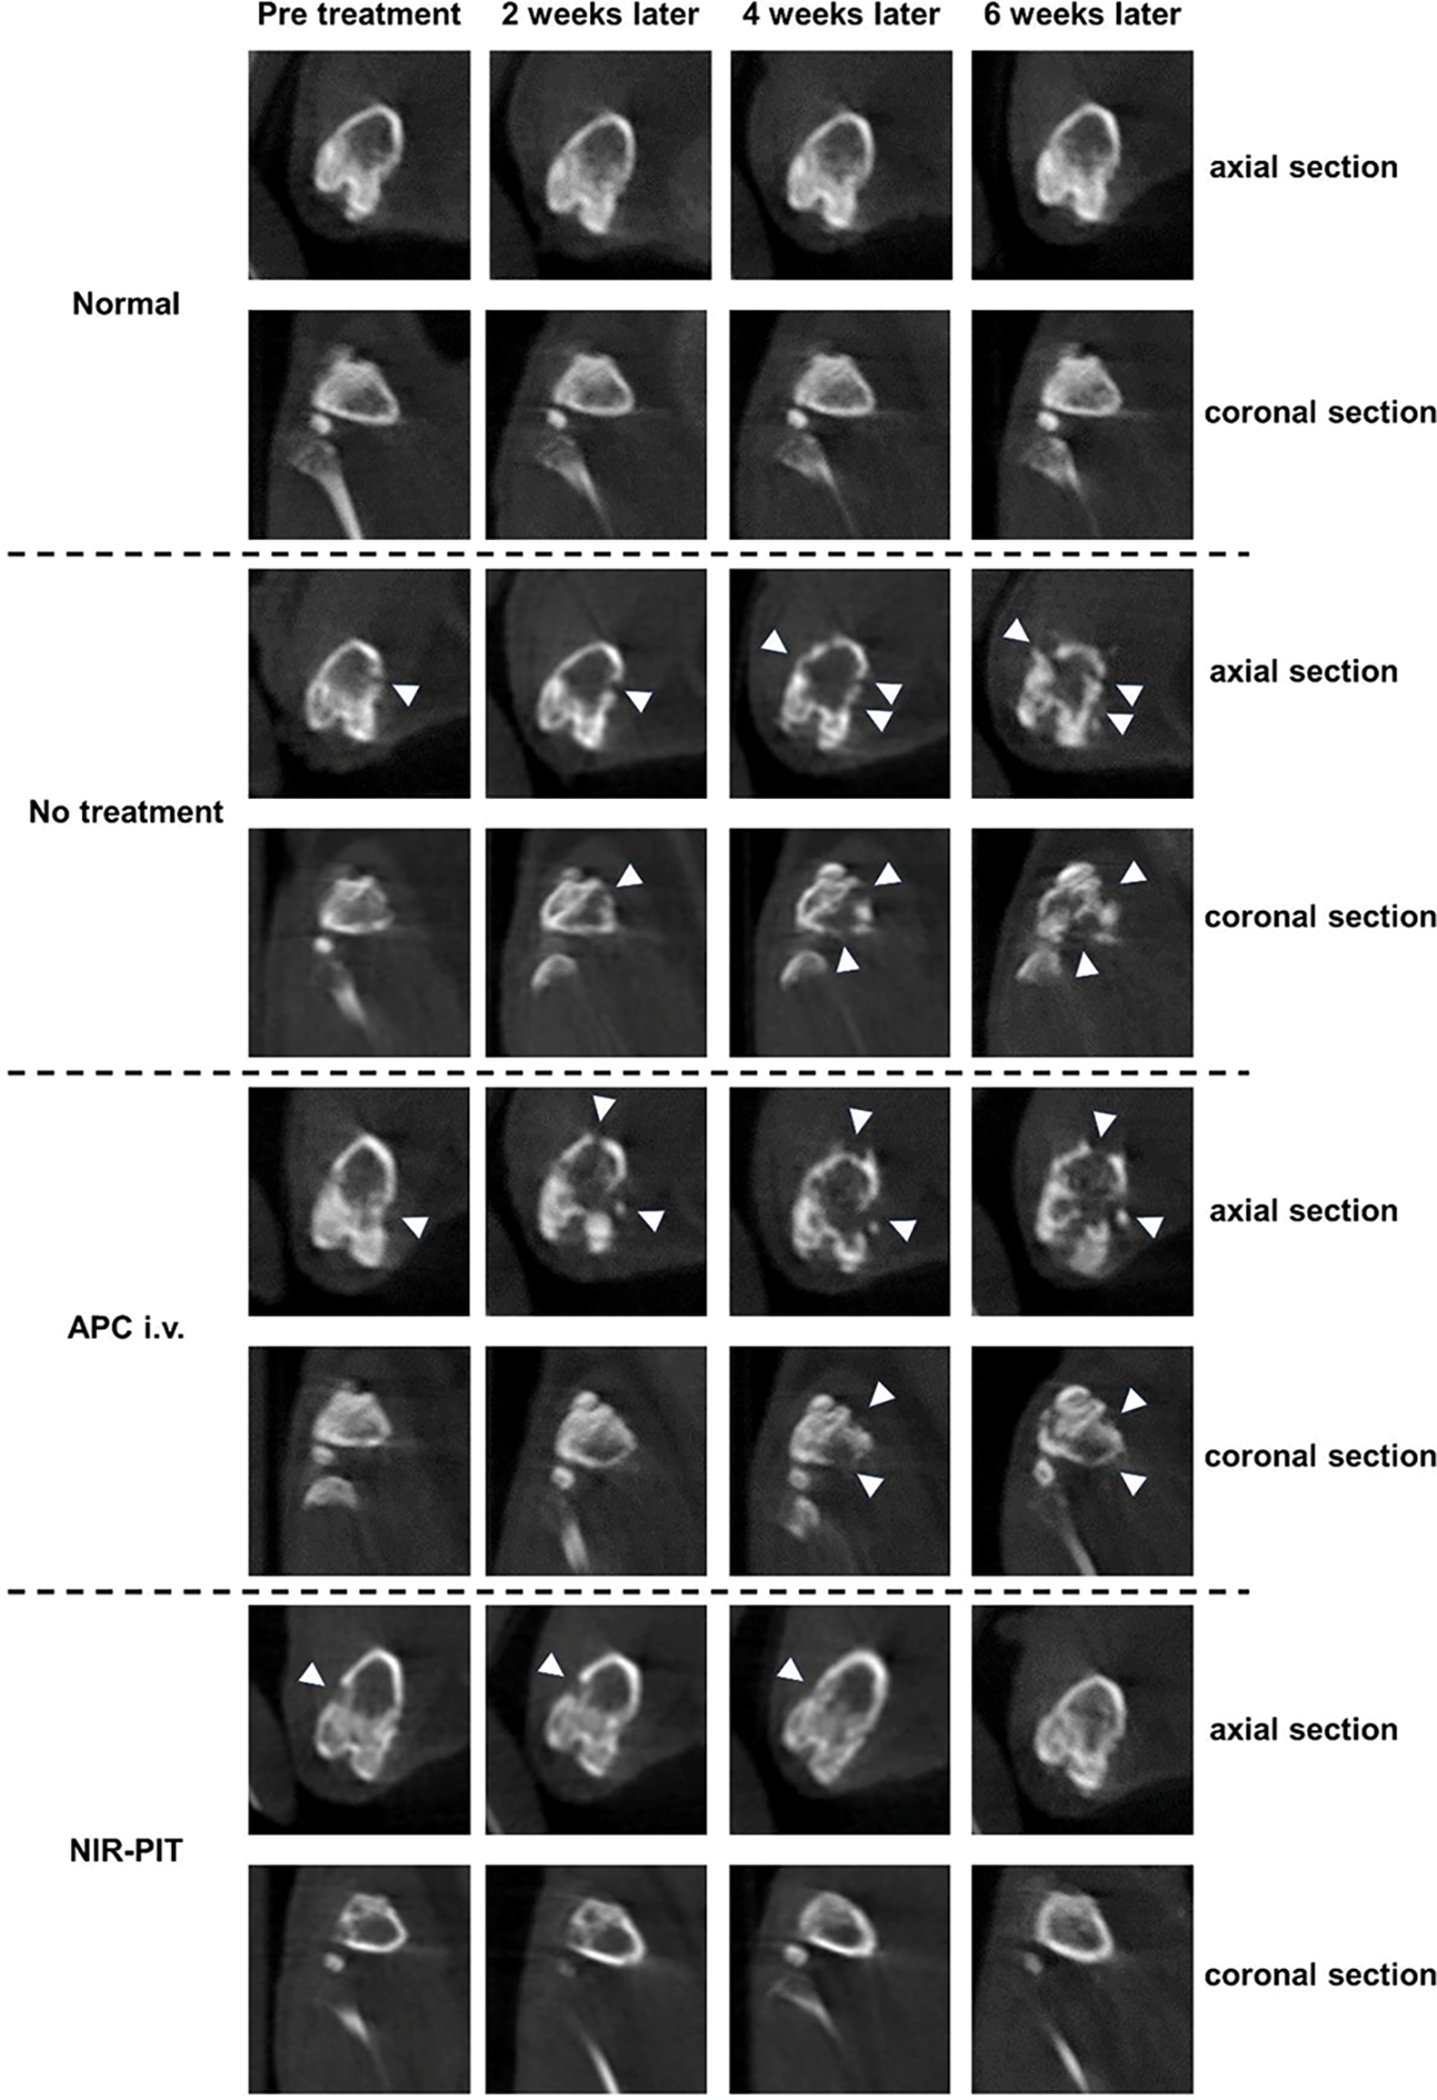
Figure 4. Micro-CT images before and after NIR-PIT.

Plain computed tomography (CT) images of mouse hind-limb bones. CT scans were taken every 2 weeks. White arrowheads indicate destructed parts of bone cortex. (upper: axial section, lower: coronal section) Radiological changes of the bone that were separately evaluated by two board-certified radiologists (H.W and H.K) are consistent in all mice (n=3) in each group.
