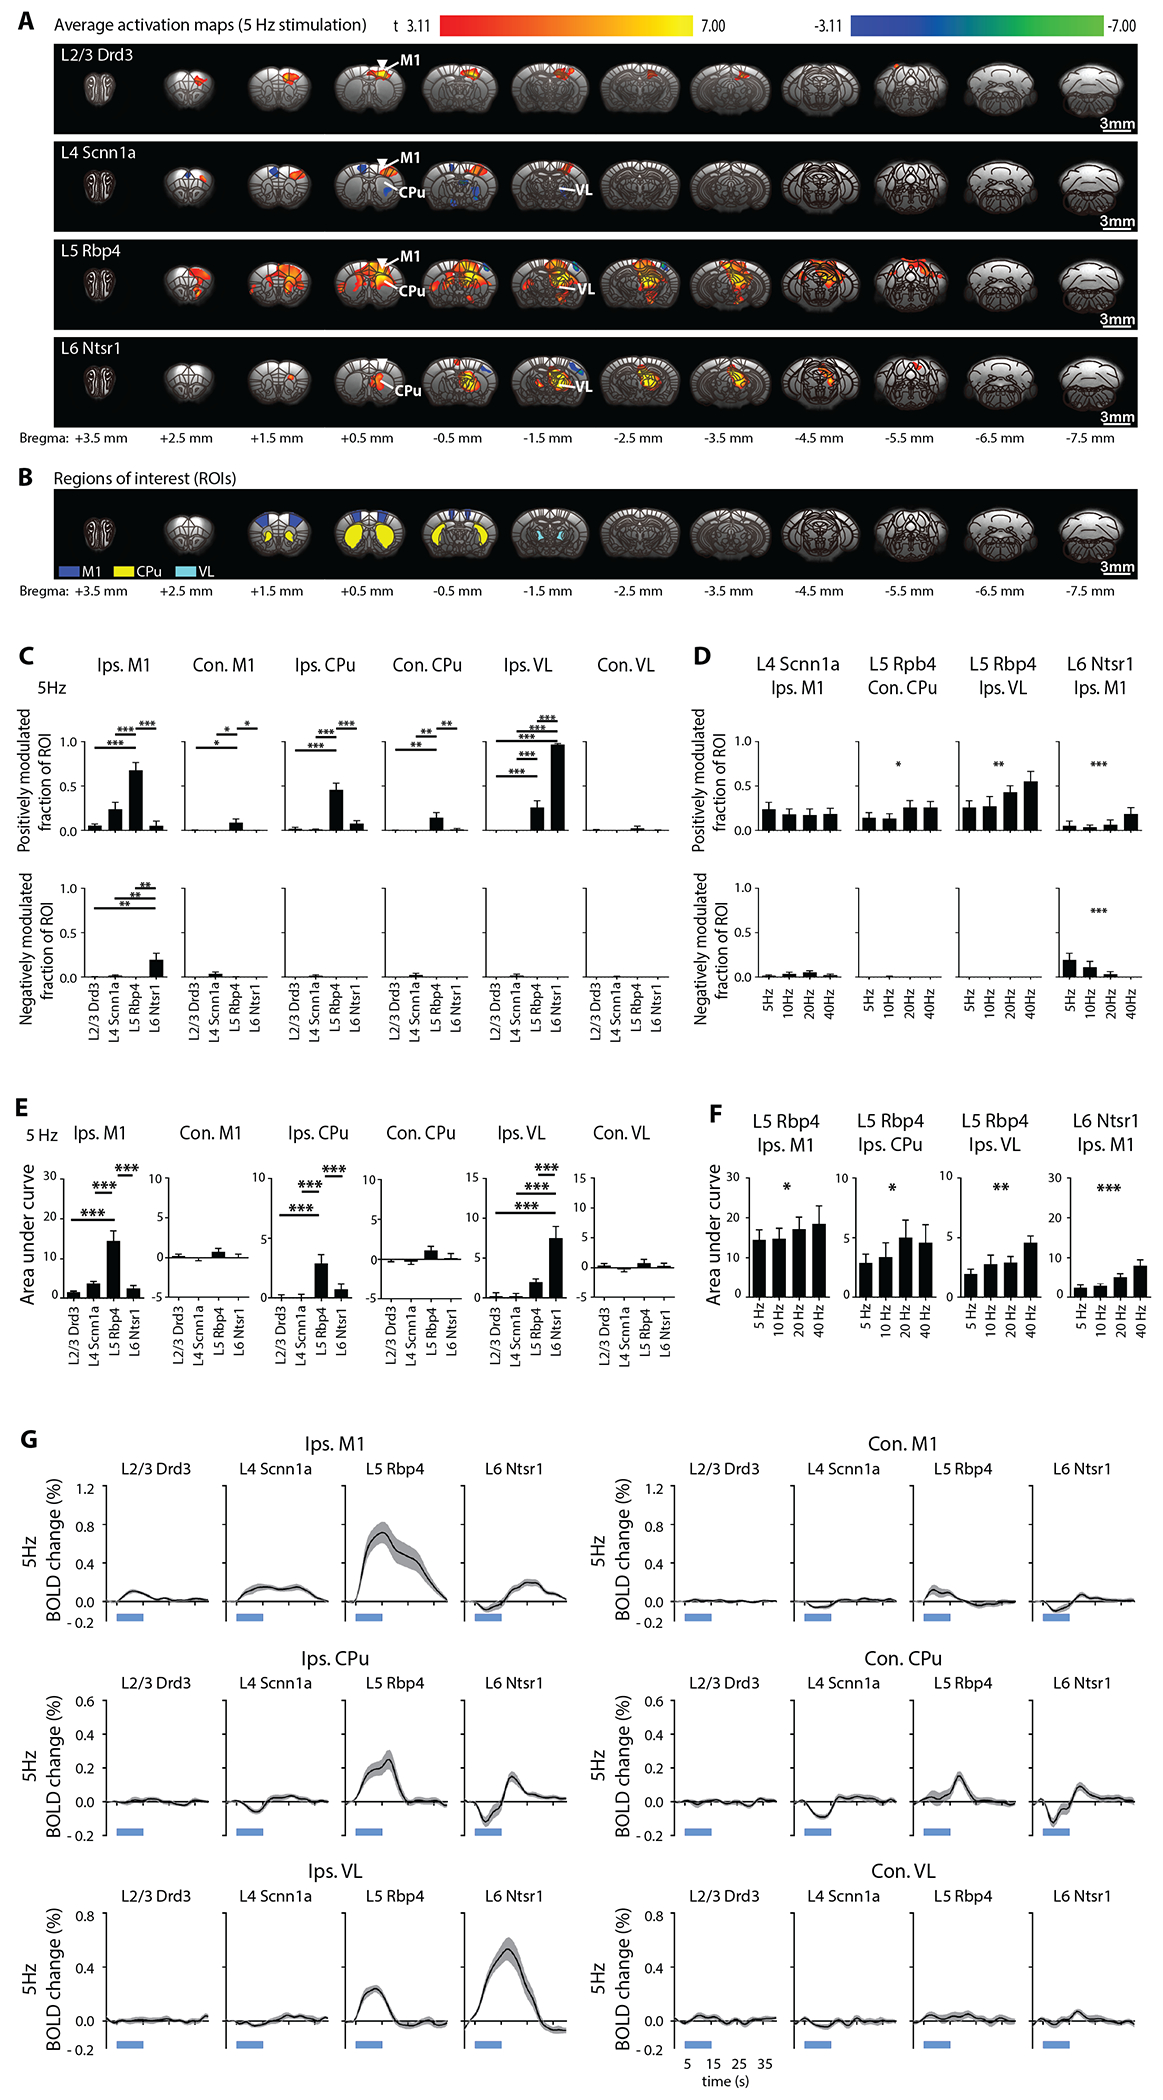
Figure 2: Stimulations of neurons specific to M1 layers evoke distinct brain-wide ofMRI responses.

(A) Group-level activation maps during Drd3 (within L2/3), Scnn1a (within L4), Rbp4 (within L5), and Ntsr1 (within L6) M1 stimulation at 5 Hz (n = 12 animals per Cre-line, total N = 48 animals; p < 0.001, FDR-corrected). Inverted white triangle indicates site of stimulation; warm and cool colors indicate positive and negative t-scores, respectively. Abbreviations: primary motor cortex (M1), caudate putamen (CPu), ventrolateral thalamic nucleus (VL). (B) Regions of interest (ROIs) are defined based on the mouse brain atlas to quantify the activation maps. (C) Fraction of ROI positively (top) and negatively (bottom) modulated were extracted. Drd3 (within L2/3) stimulation activated only ipsilateral M1. Scnn1a (within L4) stimulation activated ipsilateral M1, while small negative responses were observed in contralateral M1, ipsilateral CPu and ipsilateral VL. Rbp4 (within L5) stimulation evoked robust ipsilateral M1, bilateral CPu and ipsilateral VL activations. Ntsr1 (within L6) stimulation evoked negative ipsilateral M1 response, positive ipsilateral CPu response and robust VL activations. Rbp4 (within L5) stimulation evoked the strongest responses in ipsilateral M1 and bilateral CPu compared to stimulations within L2/3, L4 and L6. For ipsilateral VL, Ntsr1 (within L6) stimulation evoked the strongest activations, while Rbp4 (within L5) stimulation evoked stronger activations compared to stimulations within L2/3 and L4. One-way ANOVA followed by Bonferroni’s post hoc test was used (*p < 0.05, **p < 0.01 and ***p < 0.001; error bars indicate ±SEM). (D) Fraction of ROI positively (top) and negatively (bottom) modulated were extracted to compare ofMRI responses between different frequencies (5, 10, 20, and 40 Hz). The fraction of ROI positively modulated had an increasing trend with frequency in contralateral CPu and ipsilateral VL during Rbp4 (within L5) stimulation. For Ntsr1 (within L6) stimulation, ipsilateral M1 responses had increasing trends with increasing stimulation frequency for fraction of ROI positively modulated, while a decreasing trend with frequency was observed for fraction of ROI negatively modulated. One-way ANOVA followed by trend analysis was applied (*p < 0.05, **p < 0.01 and ***p < 0.001; error bars indicate ±SEM). (E) Area under the curve (AUC) was calculated for the comparison of the extracted BOLD signal. Rbp4 (within L5) stimulation evoked the strongest responses in ipsilateral M1 and ipsilateral CPu compared to stimulations within L2/3, L4, and L6, while Ntsr1 (within L6) stimulation evoked the strongest ipsilateral VL activations. One-way ANOVA followed by Bonferroni’s post hoc test was used (n = 12 animals per Cre-line, total N = 48 animals; *p < 0.05, **p < 0.01 and ***p < 0.001; error bars indicate ±SEM). (F) Similarly, AUC was calculated for the comparison of the extracted BOLD signal between different frequencies (5, 10, 20, and 40 Hz). AUC had an increasing trend in ipsilateral M1 during Rbp4 (within L5) and Ntsr1 (within L6) stimulations, as well as ipsilateral CPu and VL during ~L5 stimulation. One-way ANOVA followed by trend analysis was applied (*p < 0.05, **p < 0.01 and ***p < 0.001; error bars indicate ±SEM). (G) BOLD signal profiles. The short, thick, blue line under the x-axis indicates the 10-s light-on period. Abbreviations: primary motor cortex (M1), caudate putamen (CPu), ventrolateral thalamic nucleus (VL).
