
Figure 5: Distinct laminar ofMRI responses evoked by 5-Hz stimulations of neurons specific to M1 layers.
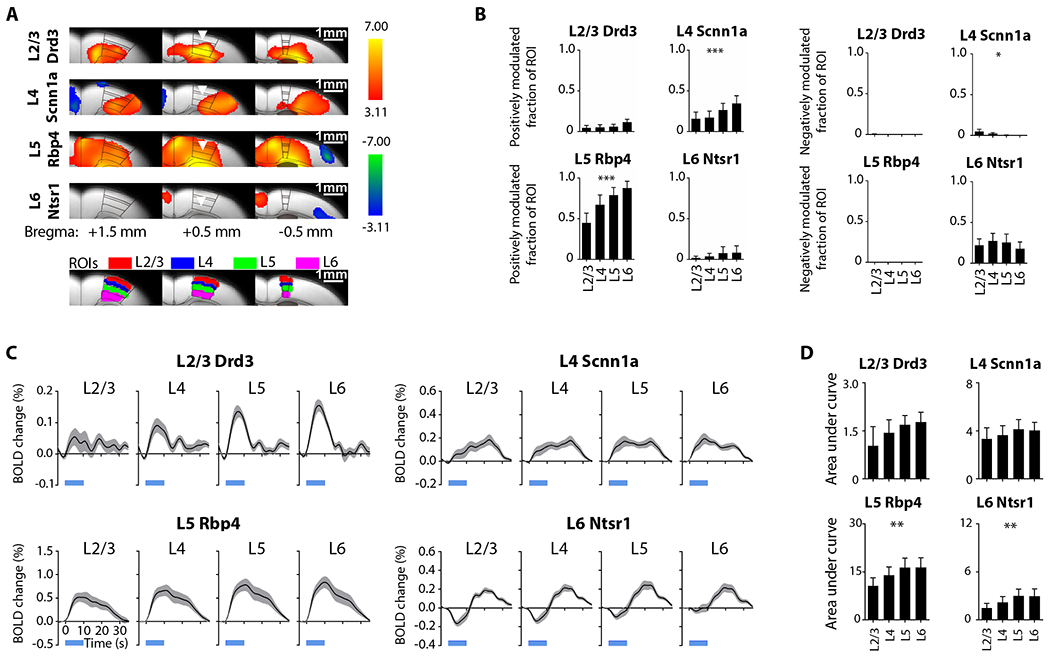
(A) Group-level M1 local activation maps during M1 stimulation within L2/3, L4, L5, and L6 at 5 Hz (n=12 animals per Cre-line, total N = 48 animals; p < 0.001, FDR-corrected). Distinct laminar fMRI responses were observed. Inverted triangle indicates site of stimulation; warm and cool colors indicate positive and negative t-scores, respectively. Regions of interest (ROIs; bottom) were defined based on the mouse brain atlas to quantify the layer-specific activations at the local ipsilateral M1. (B) Extracted fraction of ROI positively (left) and negatively (right) modulated for the comparison of ofMRI responses across different layers. Fraction of ROI positively modulated exhibit an increasing trend along the cortical depth during Scnn1a (within L4) and Rbp4 (within L5) stimulations, while fraction of ROI negatively modulated exhibit a decreasing trend along the cortical depth during Scnn1a (within L4) stimulation. (C) BOLD signal profiles extracted from the ROIs. These BOLD signal profiles also appear to exhibit an increasing trend along the cortical depth. (D) Area under the curve (AUC) was calculated form the extracted BOLD profiles for the comparison across different layers. AUC exhibit an increasing trend along the cortical depth during stimulations within L5 and L6. One-way ANOVA followed by trend analysis was applied (*p < 0.05, **p < 0.01 and ***p < 0.001). Error bars indicate ±SEM.