
Figure 6: Laminar LFP recordings along M1 cortical depth reveal layer-specific activations which correlate with laminar fMRI responses.
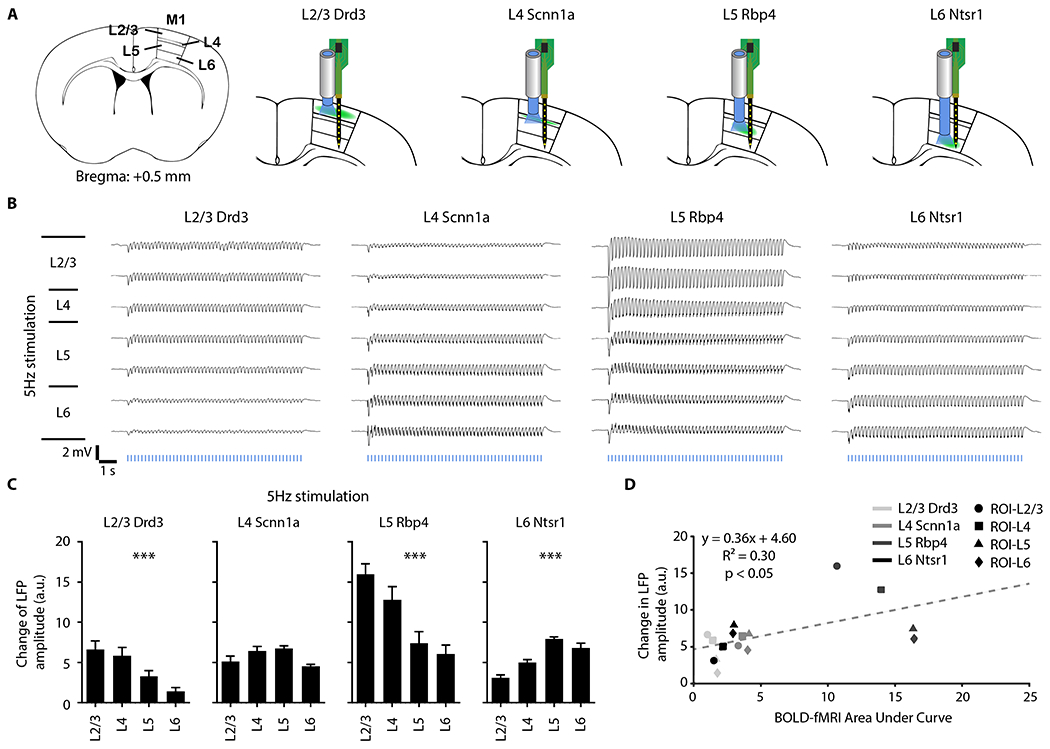
(A) Schematic shows laminar recording optrode location in ipsilateral M1 along cortical depth. (B) Average LFP traces (n = 4 animals per Cre-line, total N = 16 animals) of ipsilateral M1 along cortical depth at 5-Hz neuron-specific optogenetic stimulation. (C) Change in LFP amplitude during stimulation was calculated to quantify the LFP traces. The change in LFP amplitude decreased along the cortical depth during Drd3 (within L2/3) and Rbp4 (within L5) stimulation, while the amplitude increased along the cortical depth during Ntsr1 (within L6) stimulation. One-way ANOVA followed by trend analysis was applied (*p < 0.05, **p < 0.01 and ***p < 0.001). Error bars indicate ±SEM. (D) Scatter plot of change in LFP amplitude against BOLD-fMRI area under the curve along the cortical depth in ipsilateral M1 for all Cre-lines (p < 0.05) shows that our LFP and fMRI results are correlated.