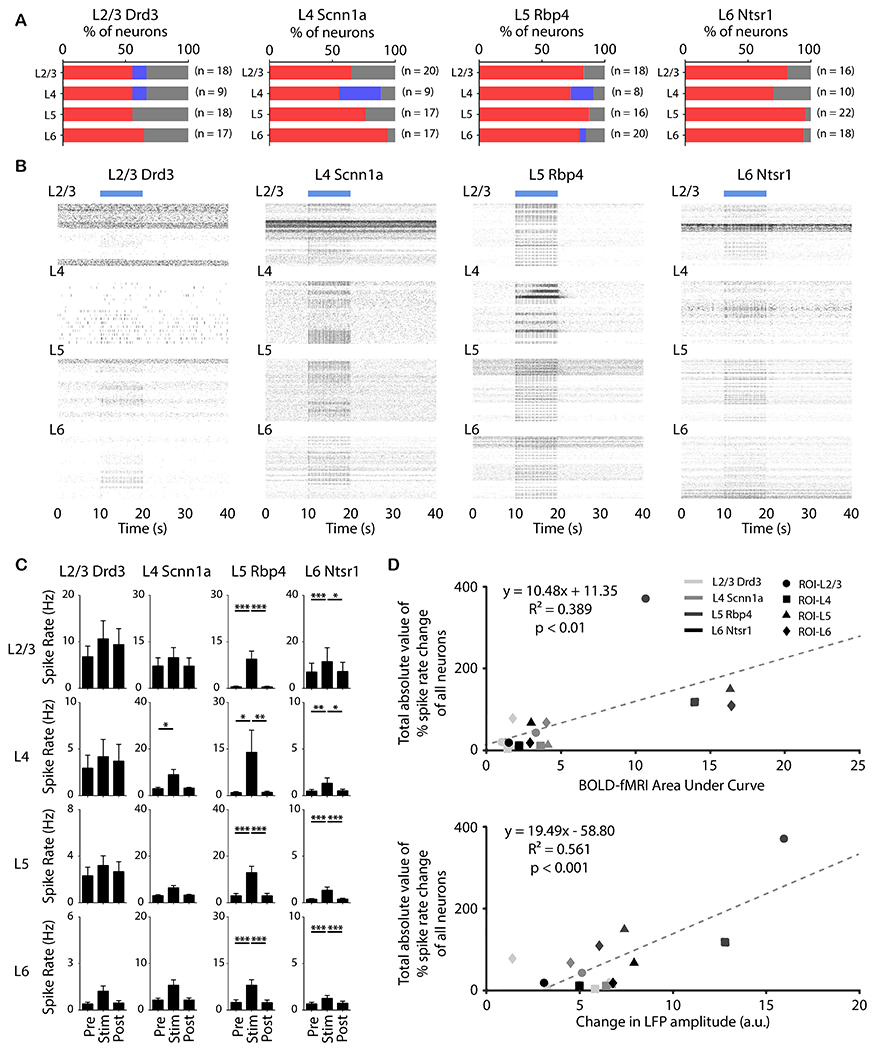
Figure 7: Distinct laminar spiking dynamics evoked by neuron-specific M1 stimulation at 5 Hz correlated with laminar fMRI responses and change in LFP amplitude.

(A) Quantification of significant changes in firing rate across recorded units. For each unit, paired student t-test was applied and results with p < 0.05 were considered significant (n = 4 animals per Cre-line, total N = 16 animals). Red, blue, and gray indicate units with significant increase, significant decrease, and no significant change, respectively, during stimulation. Over half of the recording units were modulated by the selective stimulation of neurons within each layer. Furthermore, nearly all modulated units exhibited a significant increase in firing rate. (B) Spike raster plot across all units which had significant increased firing rates along ipsilateral M1 cortical depth during stimulation within L2/3, L4, L5, and L6 at 5 Hz. Interestingly, a robust increase in spike rates was observed in L6 during Drd3 (within L2/3) stimulation. (C) Average firing rates of units which had significant increase before, during, and after stimulation (10 s periods, one-way ANOVA followed by Bonferroni’s post hoc test; *p < 0.05, **p < 0.01 and ***p < 0.001; error bars indicate ±SEM). (D) Scatter plots of total absolute value of percentage spike rate change of all neurons against BOLD-fMRI area under the curve (p < 0.01) and against change in LFP amplitude (p < 0.001).
