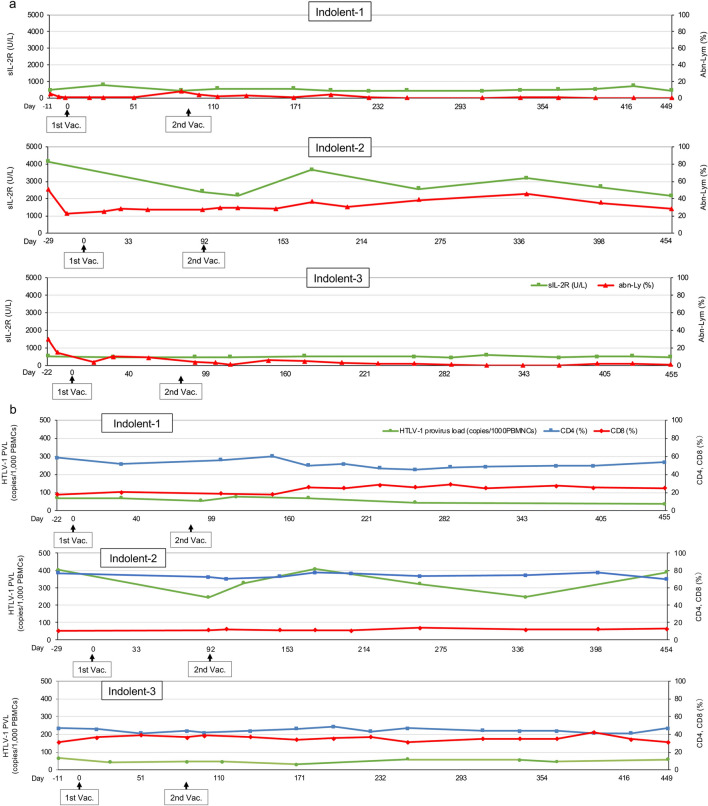
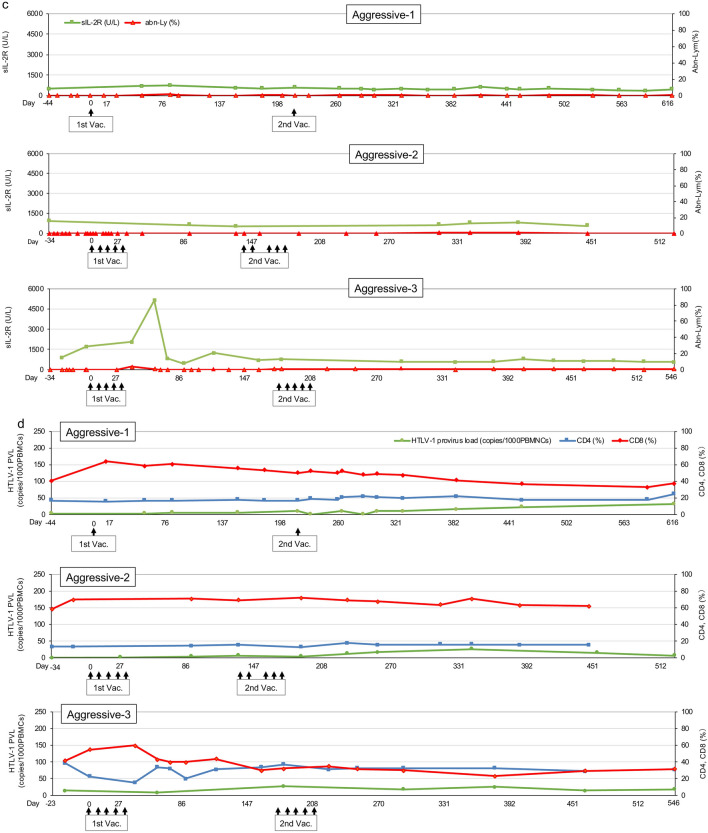
Fig. 3.
Changes in several biomarkers. a Values of sIL-2R and the percentages of abnormal lymphocytes in peripheral blood in indolent-type ATLL patients. Green lines: sIL-2R (U/L). Red lines: abnormal lymphocytes (abn-Ly) per white blood cells in peripheral blood (%). The upper, middle, and lower panels indicate data of Indolent-1, Indolent-2, and Indolent-3, respectively. b HTLV-1 provirus load (copies/1000PBMNCs) and the percentages of CD4- and CD8-positive T lymphocytes in peripheral blood in indolent-type ATLL patients. Green lines: HTLV-1 provirus load (copies/1000PBMNCs). Blue lines: CD4+ T cells per lymphocytes in peripheral blood (%). Red lines: CD8+ T cells per lymphocytes in peripheral blood (%). The upper, middle, and lower panels indicate data of Indolent-1, Indolent-2, and Indolent-3, respectively. c Values of sIL-2R and the percentages of abnormal lymphocytes in peripheral blood in aggressive-type ATLL patients. Green lines: sIL-2R (U/L). Red lines: abnormal lymphocytes (abn-Ly) per white blood cells in peripheral blood (%). The upper, middle, and lower panels indicate data of Aggressive-1, Aggressive-2, and Aggressive-3, respectively. d HTLV-1 provirus load (copies/1000PBMNCs) and the percentages of CD4- and CD8-positive T lymphocytes in aggressive-type ATLL patients. Green lines: HTLV-1 provirus load (copies/1000PBMNCs). Blue lines: CD4+ T cells per lymphocytes in peripheral blood (%). Red lines: CD8+ T cells per lymphocytes in peripheral blood (%). The upper, middle, and lower panels indicate data of Aggressive-1, Aggressive-2, and Aggressive-3, respectively. 1st Vac., first VZV vaccination; 2nd Vac., second VZV vaccination


