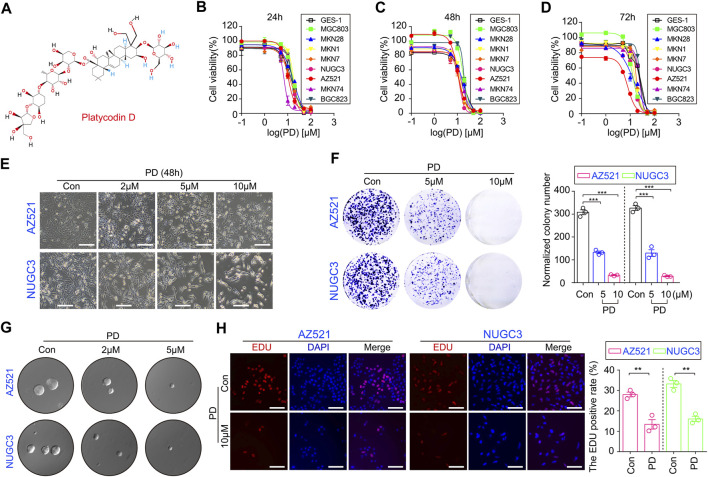
FIGURE 1.
PD inhibits cell growth and colony formation in gastric cancer cell lines. (A) The schematic diagram shows the chemical structure of PD. The CCK-8 assays were performed to assess the IC50 values of PD after treating cells for 24 h (B), 48 h (C), and 72 h (D). (E) The diagram shows the morphologies of AZ521 and NUGC3 cells treated with PD at different concentrations (0, 2, 5, or 10 μM) for 48 h (F) The clone numbers of each group were shown by a histogram. (G) The soft agar assay was performed to examine the proliferation and colony formation ability of AZ521 and NUGC3 cells after treatment with DMSO (control group) or the indicated concentrations of PD. (H) The images of EDU staining in AZ521 and NUGC3 cells treated with DMSO (control group) or 10 μM PD for 48 h. Scale bar = 100 μm. The EDU positive rates of each group were shown by a histogram. All data are mean ± SEM and are representative of three independent experiments. *p < 0.05, **p < 0.01; ***p < 0.001.

