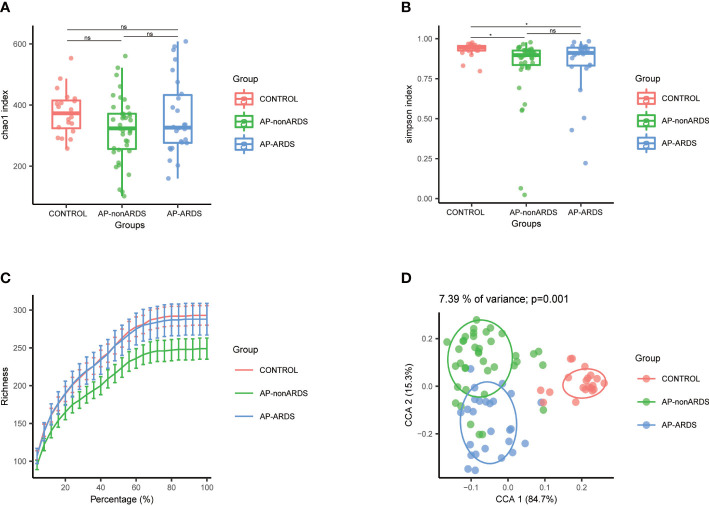
Figure 1.
Diversity analysis of Control, AP-nonARDS and AP-ARDS group. (A) Chao index of α analysis; (B) Simpson index of α analysis. There are significant differences between the Control group and AP patients, but no significant difference between AP-nonARDS and AP-ARDS group. (C) Rarefaction curves analysis. (D). Principal coordinate analysis (PCoA). CONTROL, healthy population; AP-nonARDS, AP patients without ARDS; AP-ARDS, AP patients with ARDS. * P < 0.05; ns: not significant.

