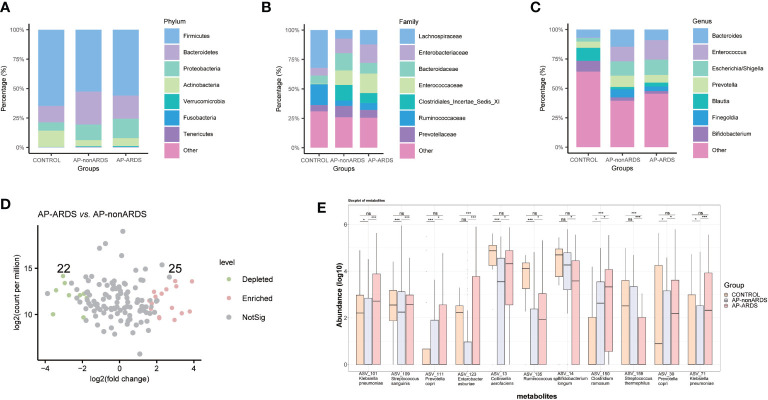
Figure 2.
Gut microbiota composition at (A) phylum, (B) family, (C) genus levels. (D) Different amplicon sequence variants (ASVs) between AP-ARDS and AP-nonARDS group. (green= depleted in AP-ARDS group; red = enriched in AP-ARDS group; gray = no significantly difference). (E) Relative abundances of different species between AP-nonARDS and AP-ARDS groups. * P < 0.05; *** P < 0.001; ns: not significant.

