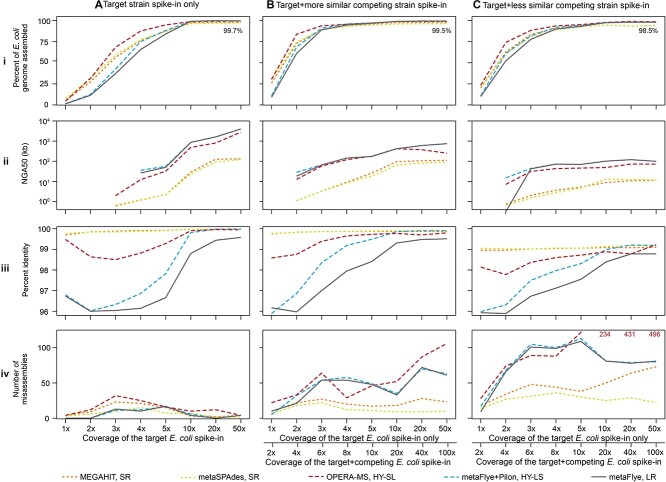
Figure 6.
For spike-ins with an equal abundance of two competing strains, assemblies were more fragmented and less accurate. Each column displays metrics for a different combination of isolate(s) spiked into background B1. (A) Isolate I1 only; (B) isolates I1 and I2 (99.7% ANI) at equal abundance; (C) isolates I1 and I3 (97% ANI) at equal abundance. Each row represents an assembly metric: (i) Percent isolate I1 assembled. The text on each graph reflects the maximum percent of the I1 genome assembled at 50x coverage out of all assemblers to show how strain multiplicity reduces genome completeness. (ii) Target E. coli (isolate I1) NGA50 (kb). (iii) Percent identity of the strain I1. (iv) The number of misassemblies in isolate I1’s assembly. Bottom right panel: Text indicates OPERA-MS misassembly values out-of-bounds.

