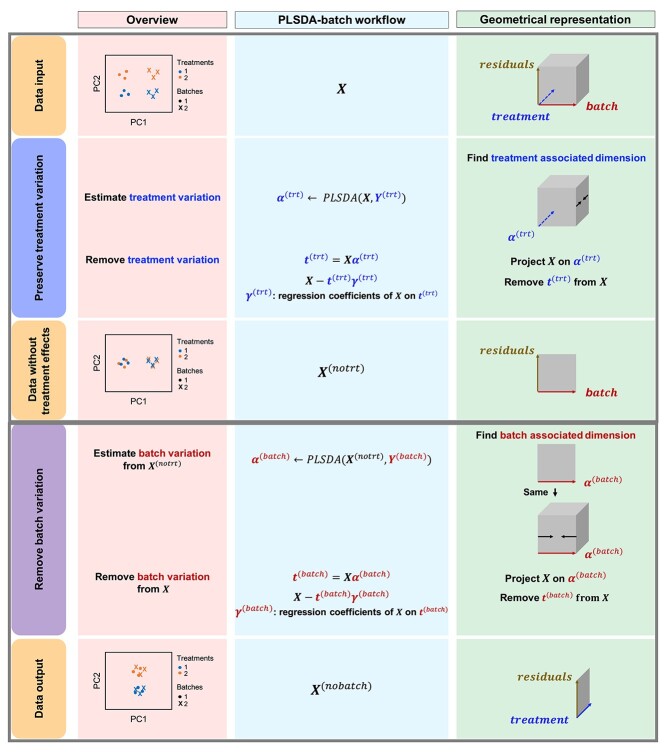
Figure 1.
PLSDA-batch framework. From left to right columns: Visualization with Principal Component Analysis sample plots; Workflow describing each step of Algorithm 1 and Geometrical representation of the approach via projections and deflation. For illustrative purpose, we only represent one component associated with either treatment or batch effects.

