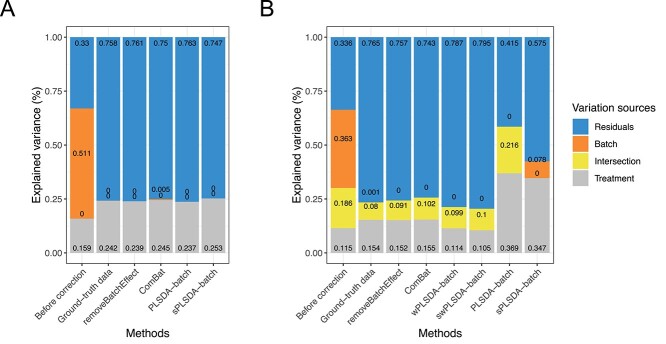
Figure 2.
Simulation studies (two batch groups): comparison of explained variance before and after batch effect correction for (A) balanced and (B) unbalanced batch  treatment designs. The method pRDA estimated the proportion of variance explained by (from top to bottom) residuals, batch effects, intersection of batch and treatment effects and treatment effects. All methods performed equally well in removing batch variance for a balanced design except ComBat, while in an unbalanced design, our weighted variants wPLSDA-batch and swPLSDA-batch performed better than their unweighted counterparts.

