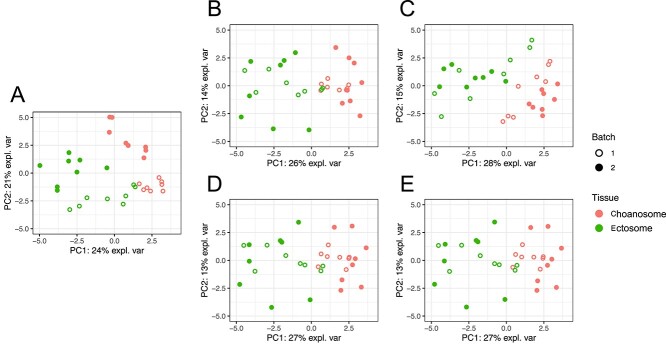
Figure 4.
PCA sample plots of the sponge data (A) before or after batch effect correction using (B) removeBatchEffect, (C) ComBat, (D) PLSDA-batch or (E) sPLSDA-batch. The colours represent the effect of interest (tissue types), and shapes the batch types. ComBat did not remove enough batch variation, as samples still present a batch separation within the cluster of Choanosome.

