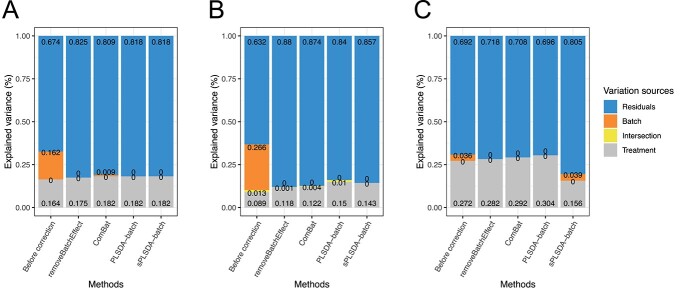
Figure 6.
Explained variance before or after batch effect correction for (A) sponge data, (B) AD data and (C) HFHS data. In sponge data (A), ComBat-corrected-data still included batch associated variance. In AD data (B), sPLSDA-batch-corrected data included a higher treatment variance and lower intersectional variance compared with the data corrected from the other methods. In HFHS data with weak batch effects (C), PLSDA-batch-corrected data preserved the largest amount of treatment variance.

