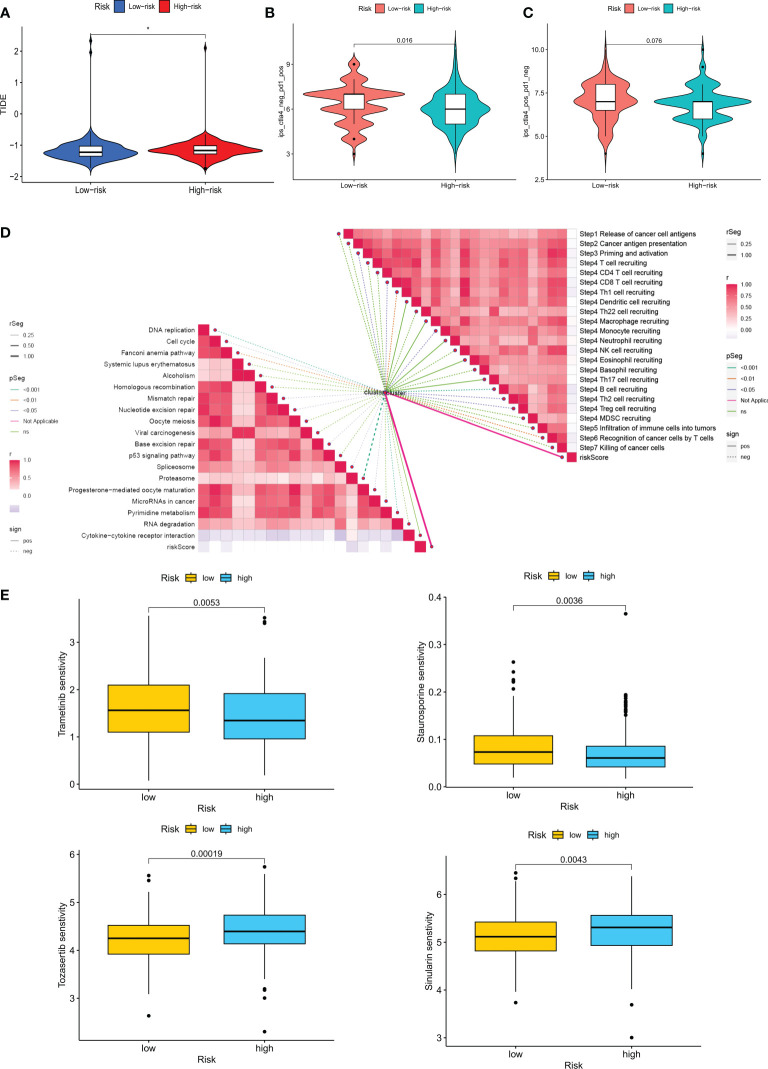
Figure 10.
Analysis of treatment outcomes between the high-risk and low-risk groups. (A) TIDE analysis between the high-risk and low-risk groups. (B, C) Comparison of the relative distribution of immune scores (IPS) between the high-risk and low-risk groups. (D) Correlation of risk scores with ICB response characteristics and each step of the tumor-immune cycle. (E) Sensitivity to Tozasertib, Staurosporine, Trametinib, and Sinularin in the high-risk and low-risk groups. *p < 0.05.

