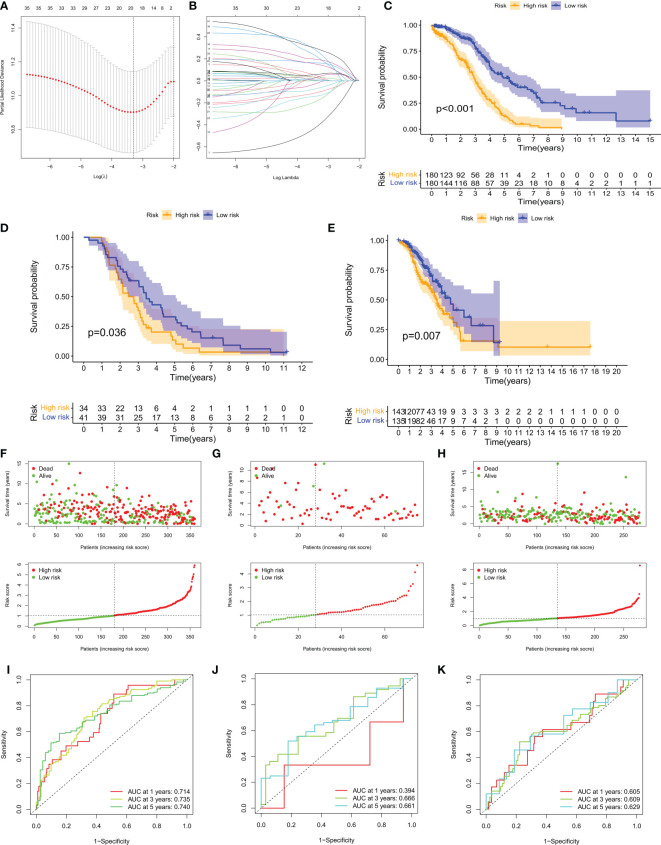
Figure 5.
Construction of CMRGPS and prognostic value of risk scores. (A, B) Linear models (Lasso) were constructed and coefficients were visualized using LASSO Cox regression to identify 19 copper metabolism-related DEGs. (C–E) Kaplan-Meier survival curves showing the risk stratification ability of the TCGA-OV, GSE63885, and GSE9891 cohorts. (F–H) Risk plots were used to illustrate the survival status of each sample in the TCGA-OV, GSE63885, and GSE9891 cohorts. (I–K) AUC values for risk scores at 1, 3, and 5 years in the TCGA-OV, GSE63885, and GSE9891 cohorts.

