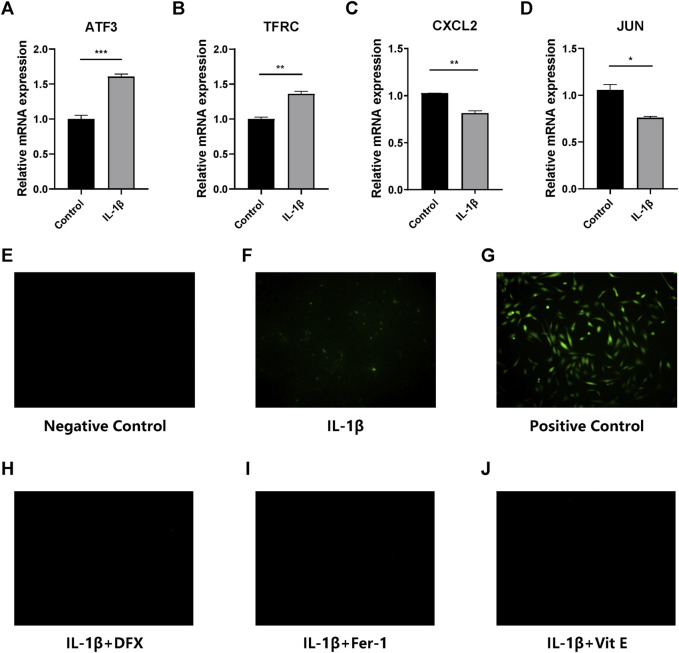
FIGURE 5.
(A–D) Quantitative real-time PCR analyses of ATF3, TFRC, CXCL2 and JUN. * p < 0.05; ** p < 0.01; *** p < 0.001. (E–J) ROS detection of the control groups and cells receiving IL-1β alone, IL-1β + deferasirox, IL-1β + ferrostatin-1 and IL-1β + vitamin E. The green fluorescence represents ROS detected in chondrocytes. DFX: deferasirox; Fer-1: ferrostatin-1; Vit E: vitamin E.

