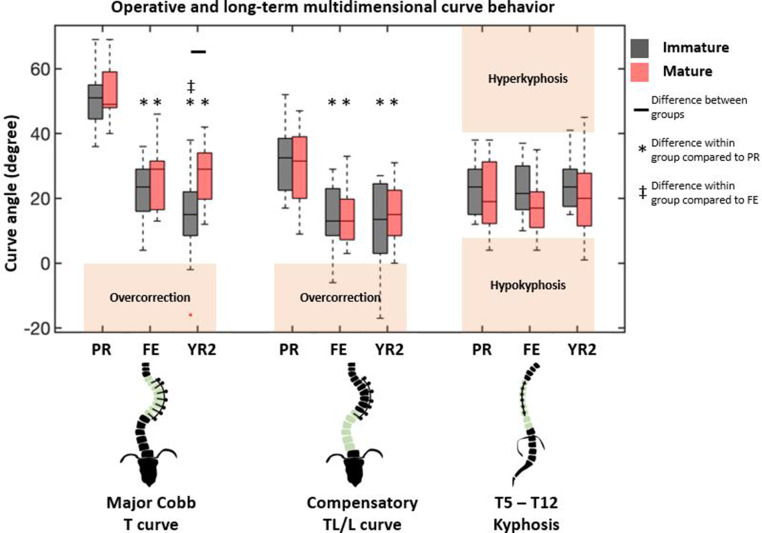
Figure 2.
Coronal and sagittal radiographic measurements at 3 timepoints show differences due to skeletal maturity only at 2-y follow-up in the instrumented thoracic curve. Differences between groups are designated by black bar. Differences within a group with reference to preoperative and first erect values are denoted by asterisk (*) and cross (‡), respectively. Boxplot interquartile range shows 25% to 75% with black bar indicating median. Outliers are designated by red plus sign (1.5 times interquartile range). Between- and within-group comparisons were done using a Mann-Whitney U test with Bonferroni correction (P < 0.05). PR, preoperative; FE, first erect; YR2, 2 y; T, thoracic; TL/L, thoracolumbar/lumbar.

