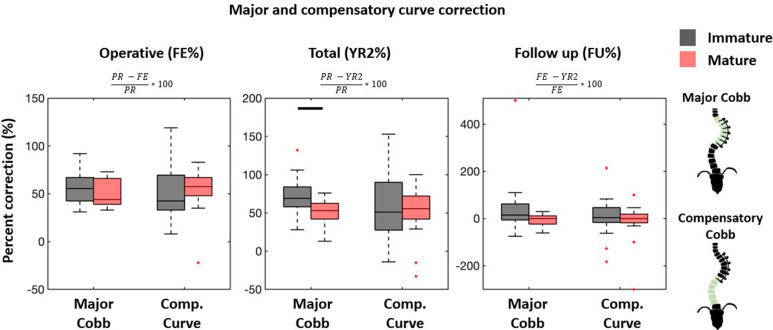
Figure 3.
Major and compensatory curve first erect and total percent correction (FE% and YR2%) are referenced to preoperative (PR) curve, whereas follow-up percent correction (FU%) compares FE with YR2. Percent correction beyond 100% defines overcorrection, and negative values define loss of correction. Large variations seen in FU% occurs with near-zero FE curves. Boxplots follow formatting described in Figure 2. Between-group comparisons were done using a Mann-Whitney U test with Bonferroni correction (P < 0.05).

