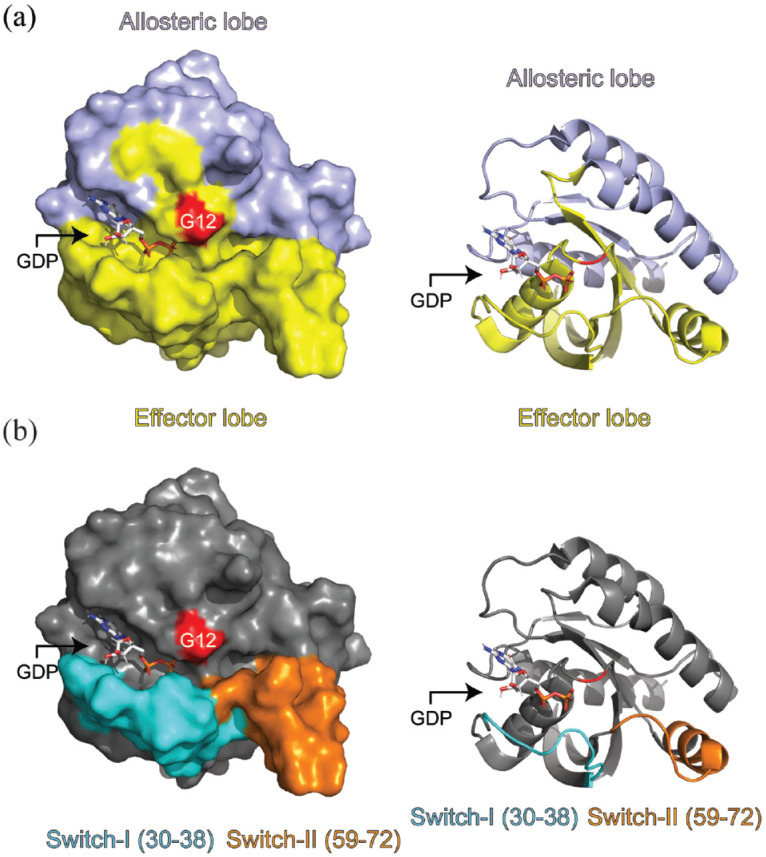
Figure 1.

KRASWT complexed with GDP (PDB: 4OBE). (a) Allosteric and effector domains denoted by either purple or yellow colors, respectively. (b) Switch-I and Switch-II regions are colored cyan and orange, respectively. The red highlighted residue is G12. Switch-I is residues 30–38 inclusive while switch-II was considered residues 59–72 inclusive. Images were generated using PyMol version 2.5.2.
