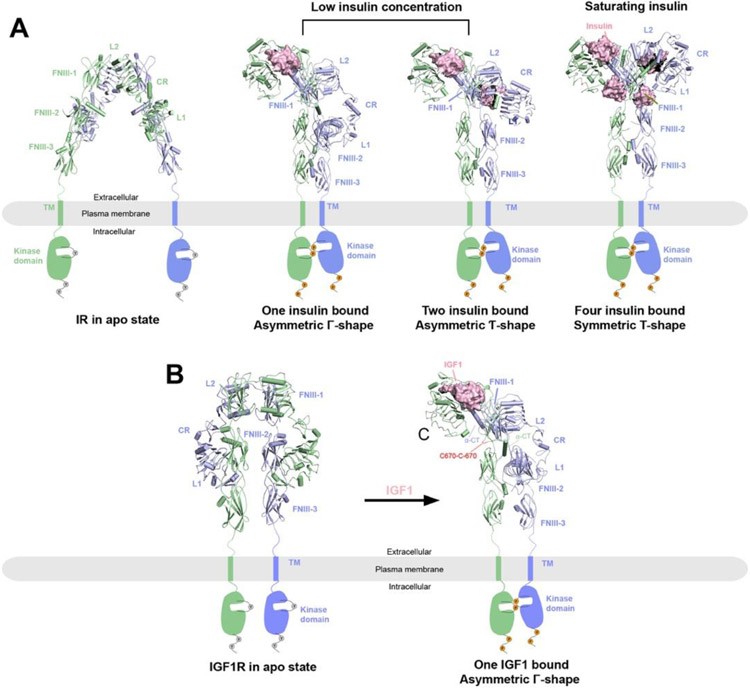
Figure 1.
Overall structures of IR and IGF1R in apo and ligand bounds states reveal activation mechanisms. The two protomers in the receptor dimers are shown in cartoon (blue and green) representations, whereas the ligands are shown in surface (pink) representations. The missing TM and kinase domains in the structures are indicated by schematic drawings. Binding of ligands (insulin or IGF1) leads to conformational changes to the ECD of the receptors, with subsequent dimerization of the TM and kinase domains and activation of the receptors as indicated by the phosphorylation of the kinase domains and C-terminal tails.
A) Structures of IR at different states. Left, IR in apo state as an auto-inhibited, Λ-shaped homodimer with lower domains separated (PDB: 4ZXB); middle, full-length 2:1 or 2:2 IR/insulin complexes as Γ- or Ƭ-shaped asymmetric dimers respectively at low insulin concentrations (PDBs: 7STI and 7STJ); right, full-length 2:2 IR/insulin complex as a T-shaped symmetric dimer at saturating insulin concentrations (PDB: 6PXV).
B) Left, crystal structure of apo-IGF1R in apo state as an auto-inhibited, Λ-shaped dimer (PDB: 5U8R). Right, cryo-EM structure of full-length 2:1 IGF1R/IGF1 complex (PDB: 6PYH) showing a Γ-shaped asymmetric dimer with two α-CT motifs covalently linked by disulfide bonds.

