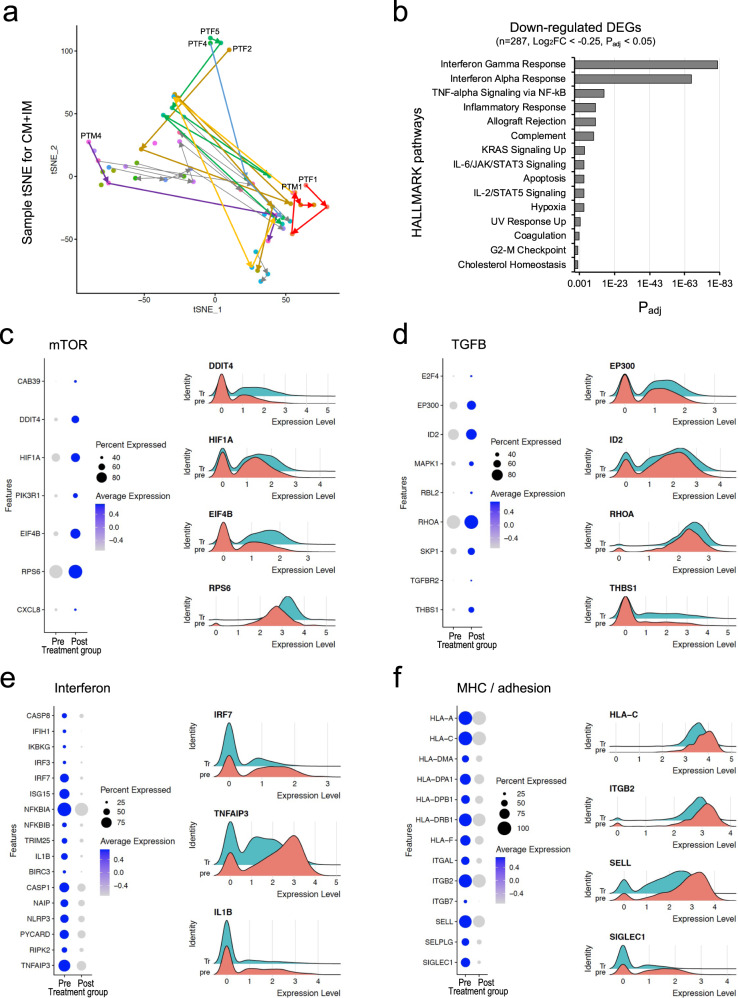
Fig. 3. Corticosteroid treatment suppresses the type-I IFN response in classical monocytes (CMs) and intermediate monocytes (IMs).
a tSNE plot of pseudobulk gene expression values for CMs/IMs in each sample. Colors represent individual patients. Arrows indicate the progression of time. Six patients with a pretreatment sample are labeled with text. b HALLMARK pathway enrichment analysis of genes downregulated by corticosteroid treatment. Padj, adjusted P value. c–f Expression of genes related to key signaling pathways. Left, dot plots depicting the percentage of cells in which the gene was detected (“Percent Expressed”) and average expression level of the gene (scaled data) in each cluster (blue, “Average Expression”). Right, ridge plots depicting the expression of genes changed between pre- and post-corticosteroid treatment.

