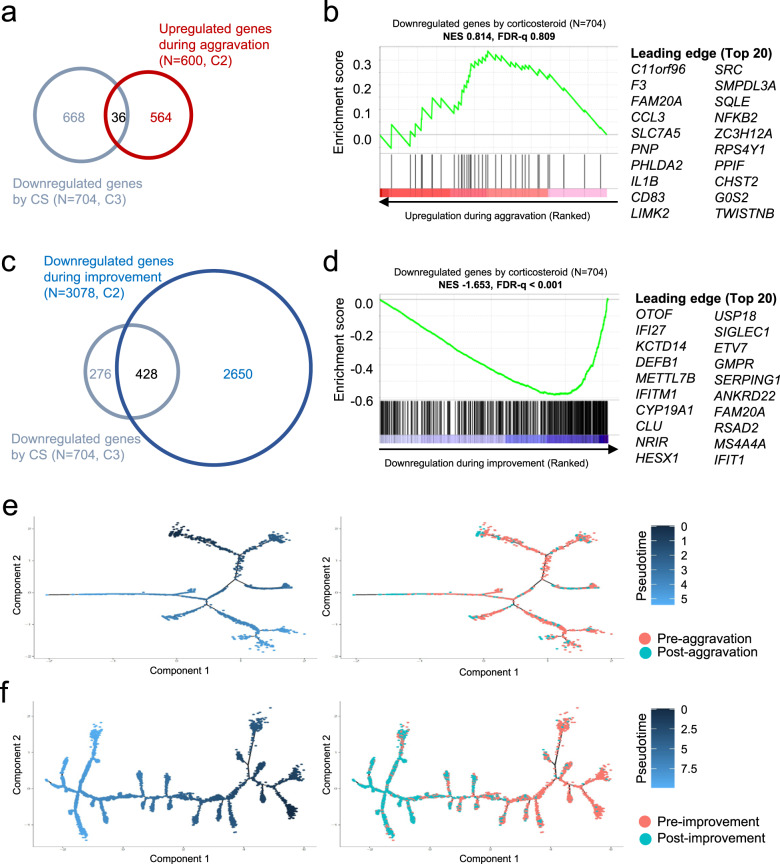
Fig. 6. Similarities between genes downregulated by corticosteroid (CS) treatment and genes with altered expression during the course of COVID-19 in classical monocytes (CMs) and intermediate monocytes (IMs).
a Venn diagram showing the overlap of genes downregulated by CS treatment (n = 704, C3) and genes upregulated during aggravation of COVID-19 (n = 600, C2). b Gene set enrichment analysis of genes upregulated during aggravation of COVID-19 (n = 600, C2 in a) for gene sets downregulated by CS treatment. FDR, false discovery rate; NES, normalized enrichment score. c Venn diagram showing the overlap of genes downregulated by CS treatment (n = 704, C3) and genes downregulated during improvement of COVID-19 (n = 3078, C2). d Gene set enrichment analysis of genes downregulated during the improvement of COVID-19 (n = 3078, C2 in c) for gene sets downregulated by CS treatment. e, f Trajectory plots for CMs/IMs in samples from cohort 2 during disease aggravation (e) or improvement (f). The cells were ordered by the expression of u-ISGs. Colors represent pseudotime (left) or samples (right).

