
FIGURE 3.
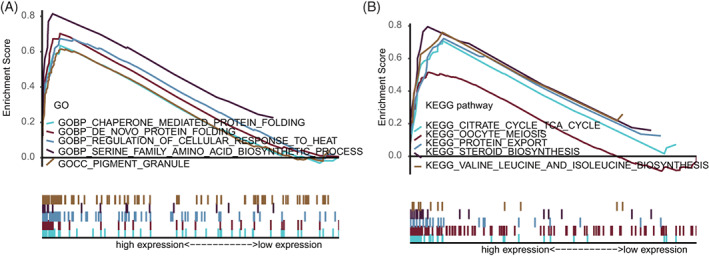
GSEA between high‐ and low‐risk groups (A) GO enrichment analysis between high‐ and low‐risk groups. (B) KEGG pathway enrichment analysis between high‐ and low‐risk groups. GO, gene ontology; GSEA, gene set enrichment analysis; KEGG, Kyoto and encyclopedia of Genes and Genomes