
FIGURE 7.
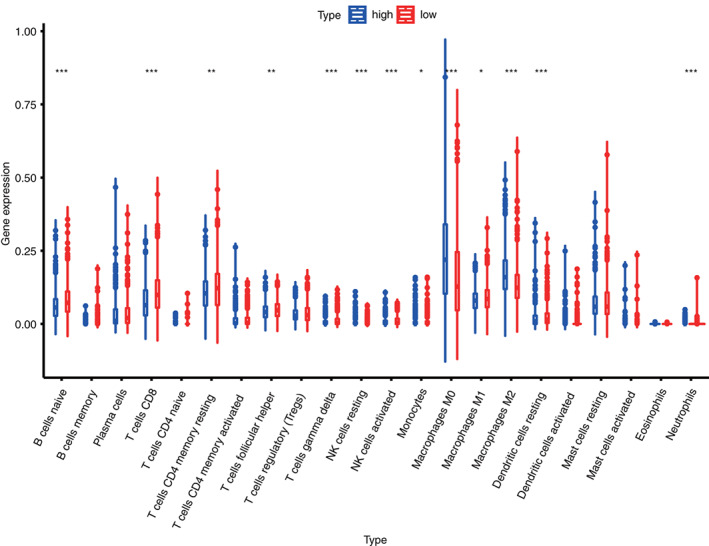
Box plot of the differences in immune cell infiltration between high‐risk and low‐risk groups in the training set
Official websites use .gov
A
.gov website belongs to an official
government organization in the United States.
Secure .gov websites use HTTPS
A lock (
) or https:// means you've safely
connected to the .gov website. Share sensitive
information only on official, secure websites.
Box plot of the differences in immune cell infiltration between high‐risk and low‐risk groups in the training set