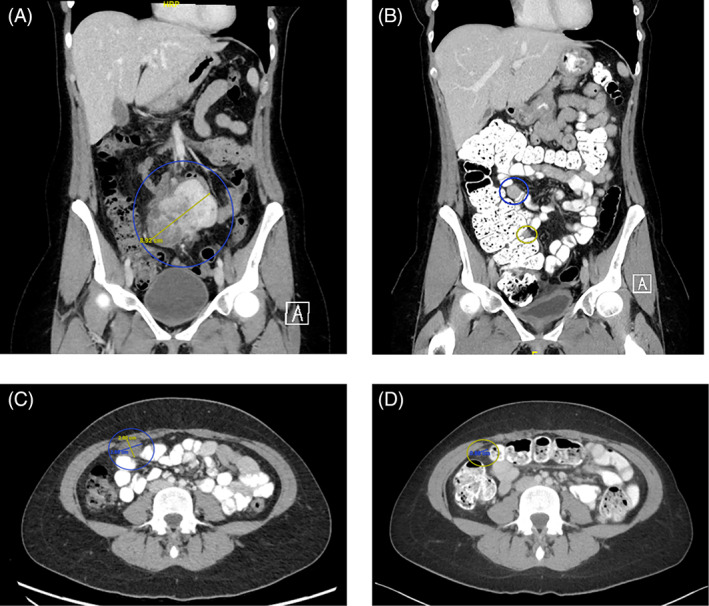
FIGURE 1.

Computed tomography of the abdomen and pelvis. (A) Coronal images at time of diagnosis, demonstrating an 8.9 cm mesenteric mass. (B) Coronal images obtained 4 months after resection, with circles indicating sites of disease recurrence. (C) Axial image obtained 3 months after initiation of alectinib treatment. A 2 cm tumor mass is circled. (D) Axial image at similar level as that in image (C), obtained 14 months after initiation of alectinib treatment. The previously noted mass is now less than 1 cm maximal dimension.
