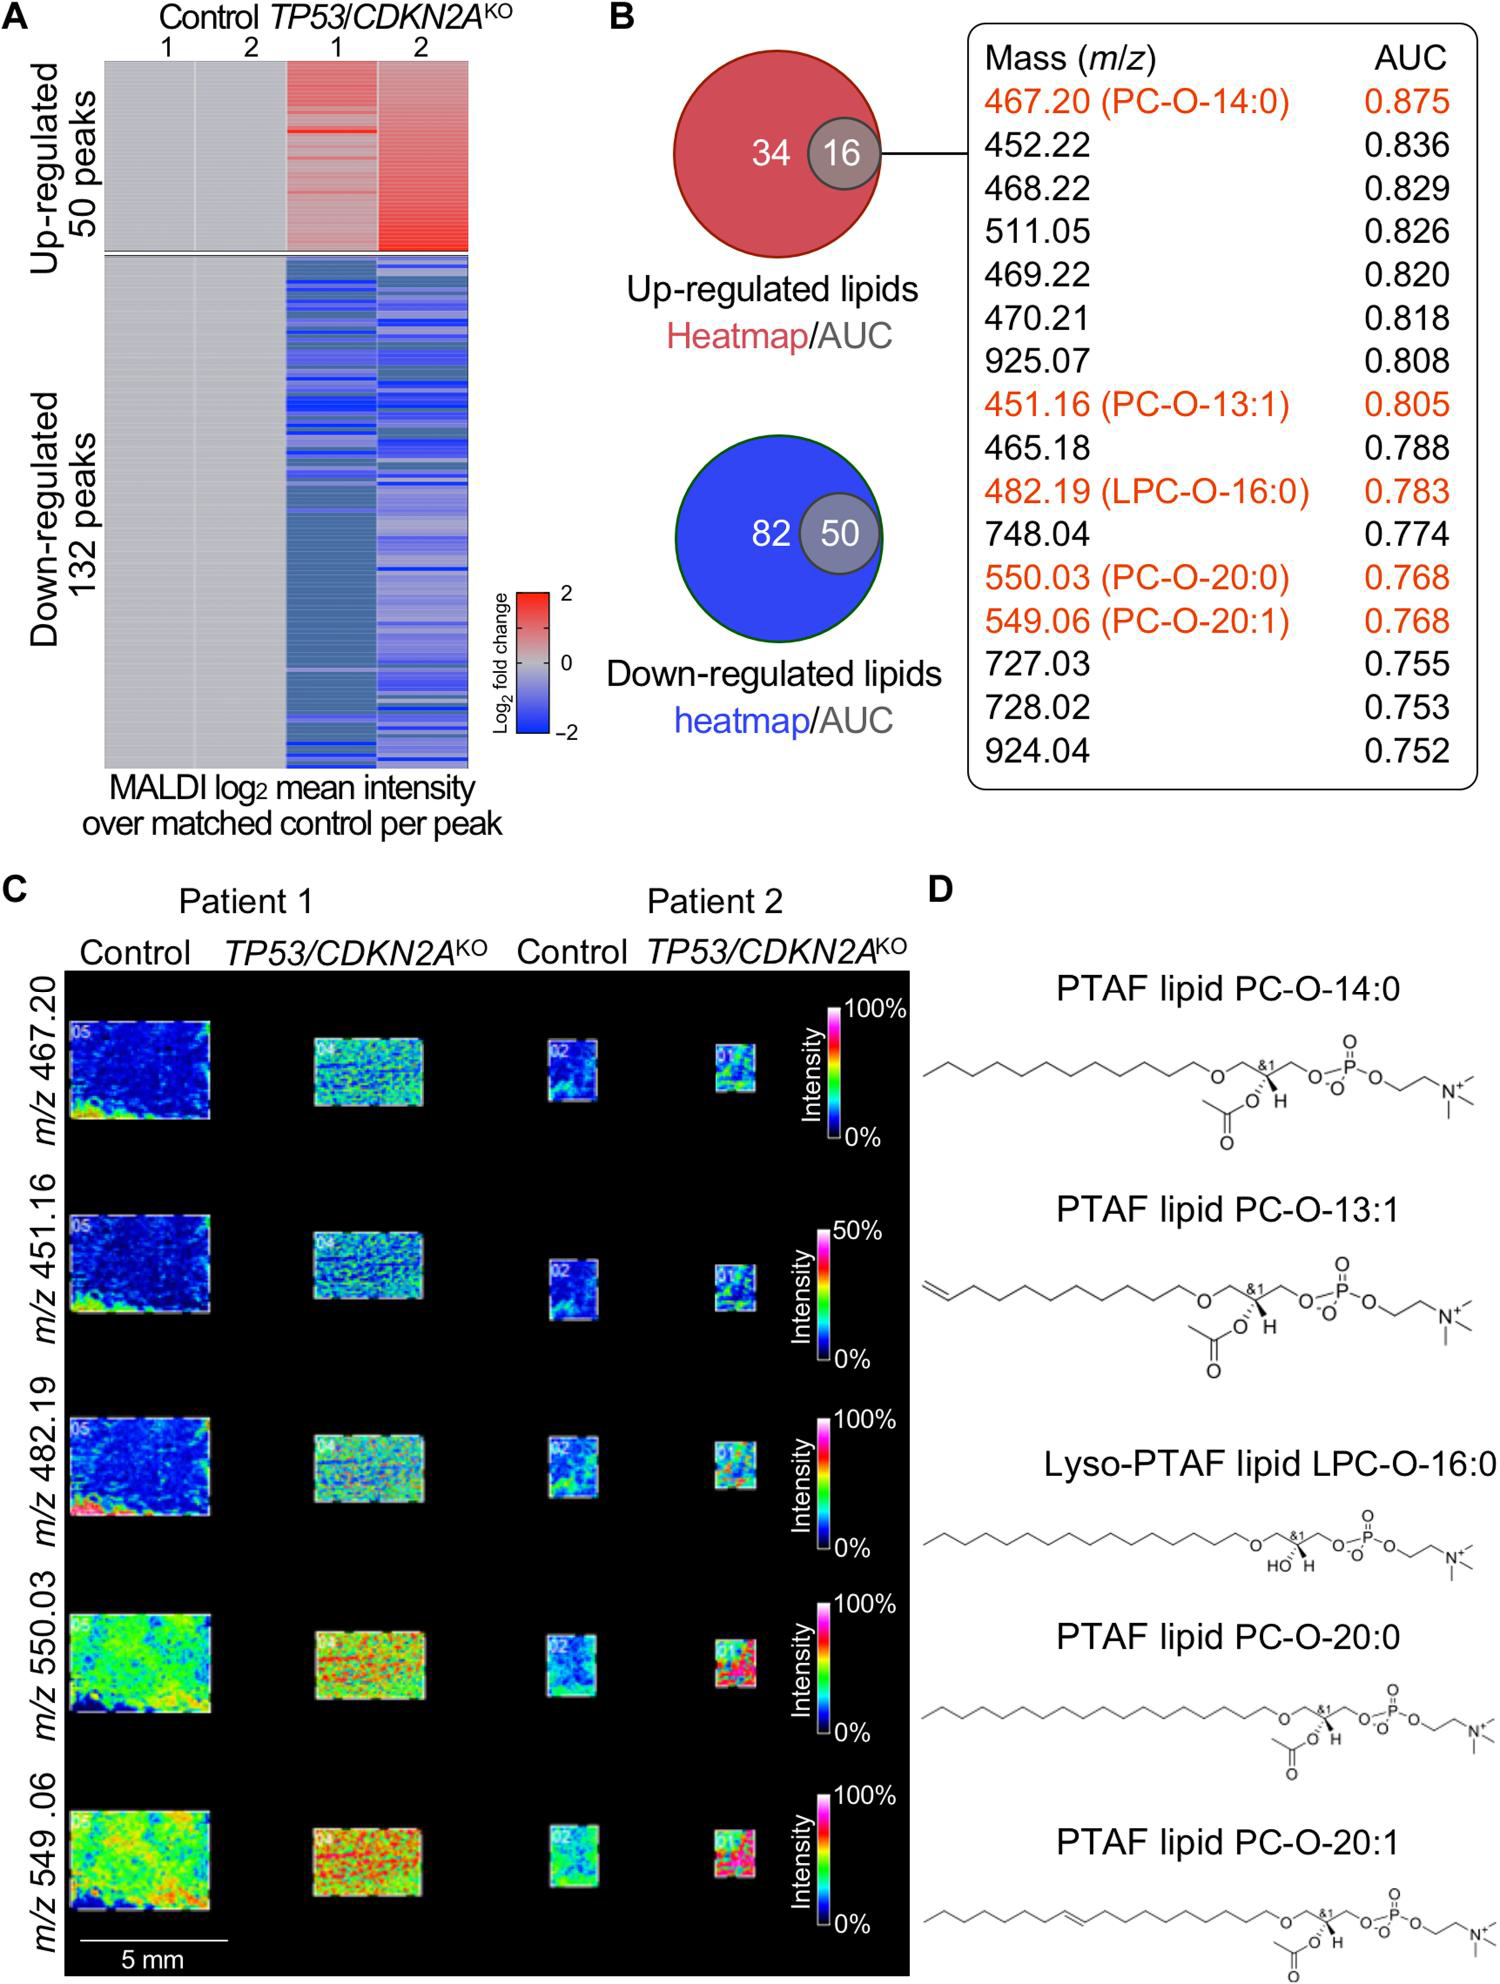
Fig. 3. PTAF lipids are increased in TP53/CDKN2AKO as compared to control GEJ organoids.

MALDI imaging–based lipidomic analysis was performed on independent paired sets of TP53/CDKN2AKO versus control GEJ organoids derived from two different patients. (A) Heatmap of discriminative lipid peaks (m/z) with a cutoff of m/z >450, a mean absolute fold change value of >1.5, and an individual absolute fold change of >1.2 in each TP53/CDKN2AKO organoids, compared with matched control. (B) Venn diagrams represent the overlap of up-regulated and down-regulated lipids based on AUC and heatmap results. Sixteen overlapping up-regulated lipids and AUC values are listed. (C) MALDI imaging and (D) corresponding chemical structures of representative PTAF lipids in TP53/CDKN2AKO organoids.
