
Fig. 4. Blockade of PTAF/PTAFR inhibits growth and proliferation of TP53/CDKN2AKO GEJ organoids.
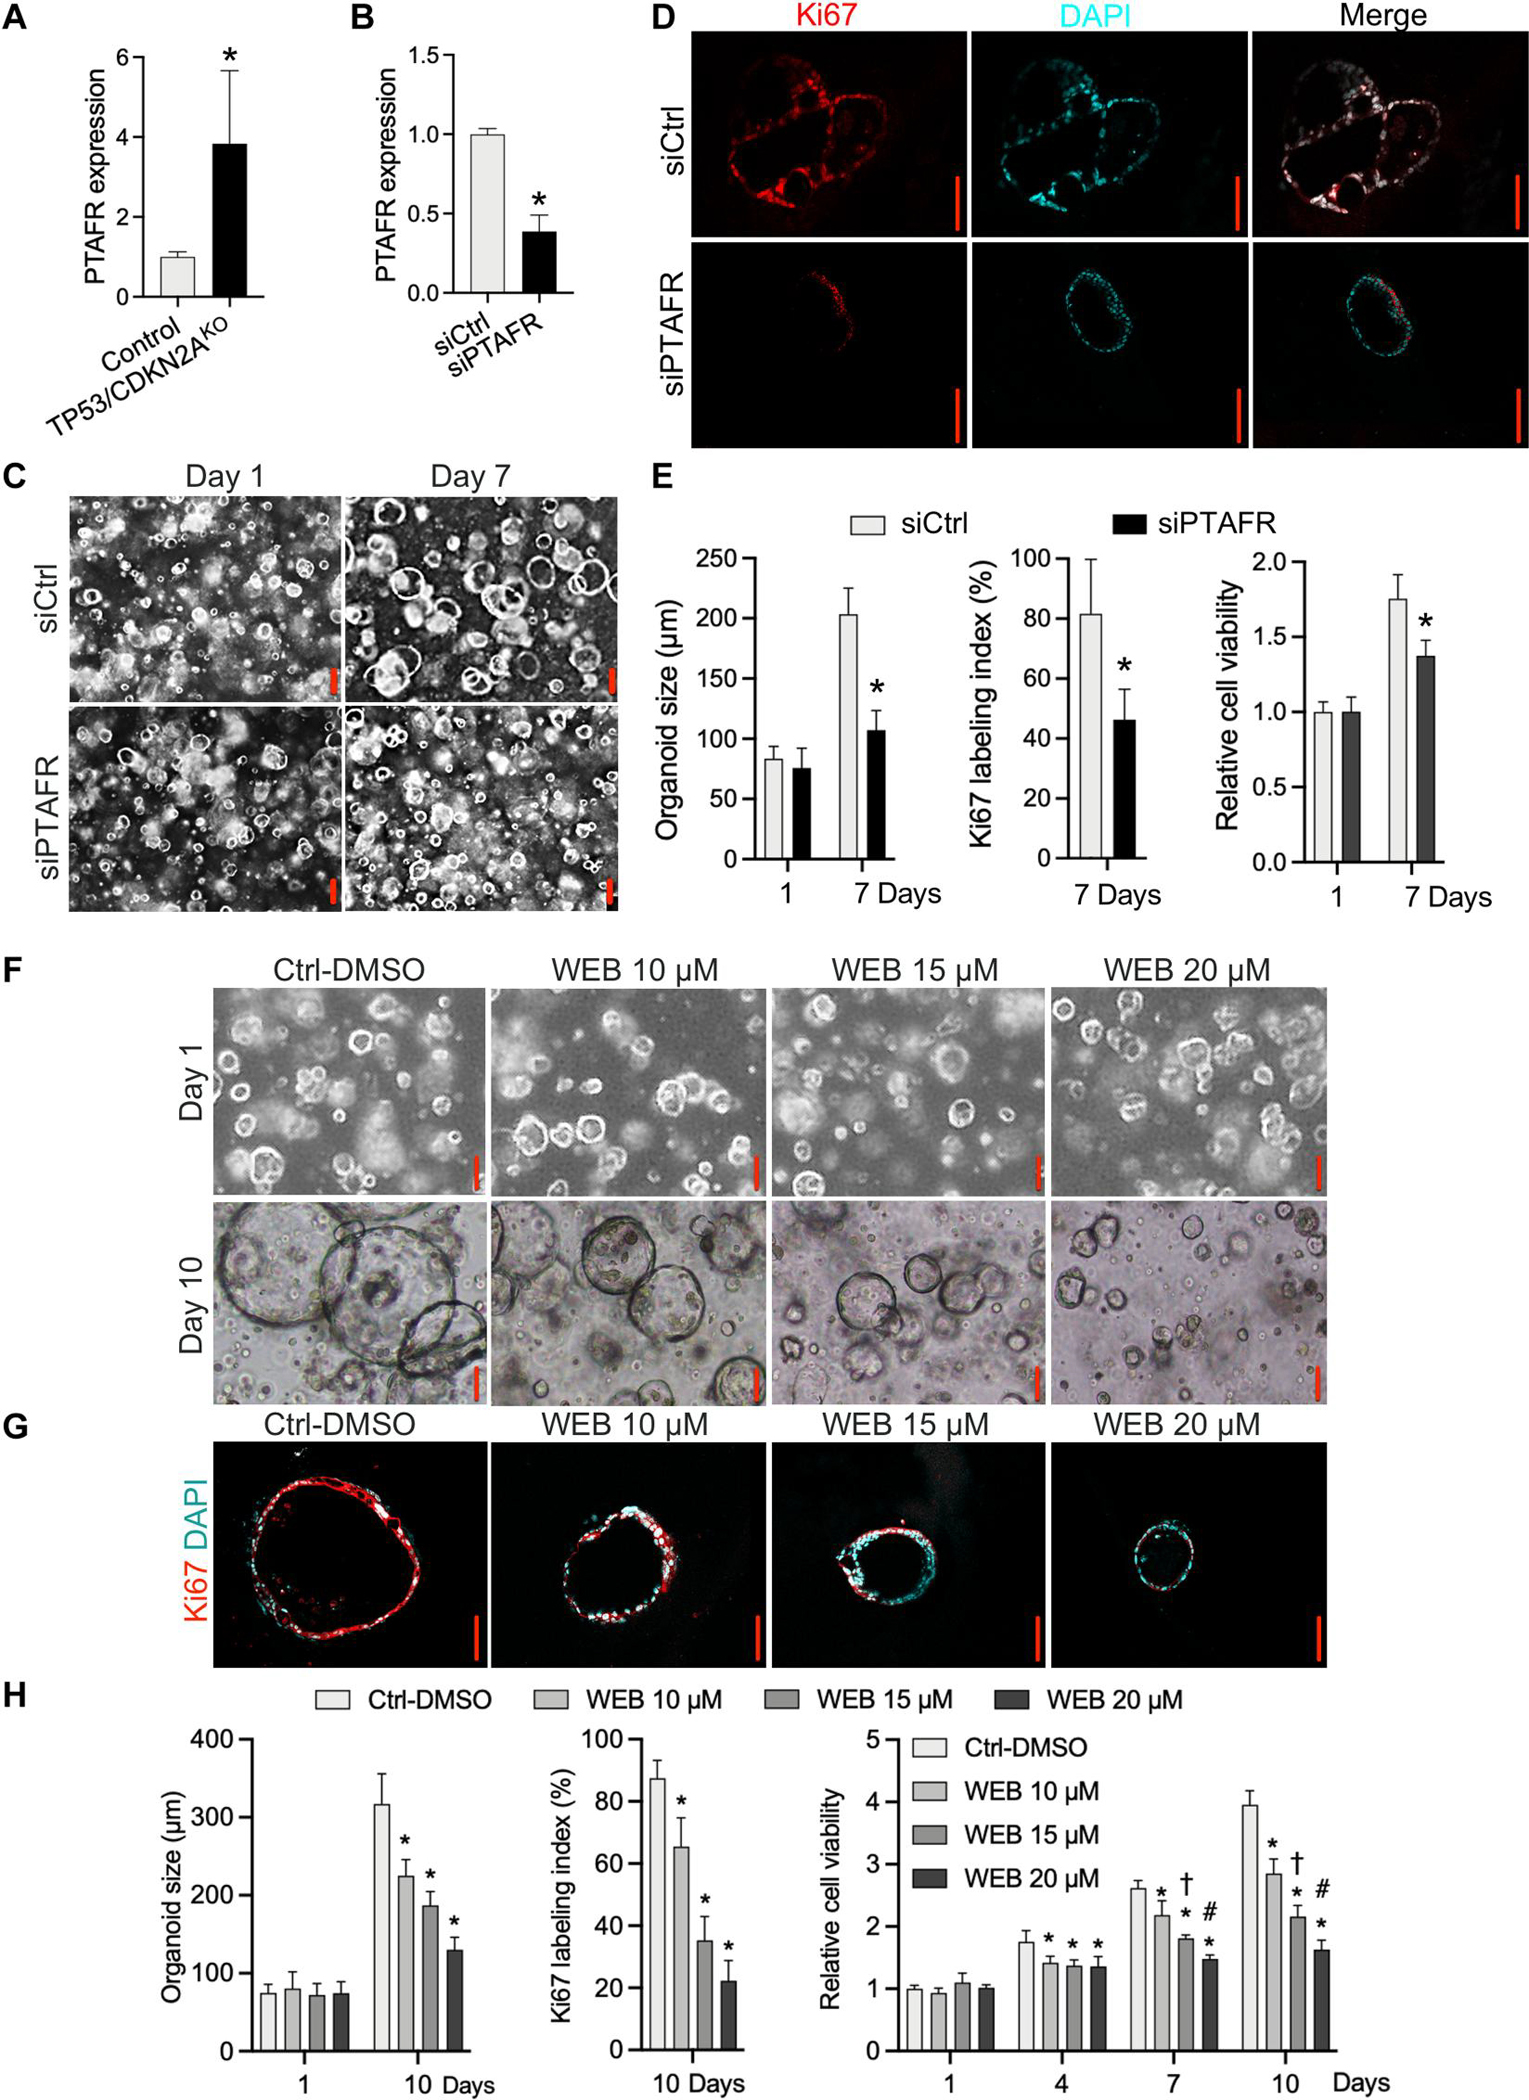
(A) mRNA expression of PTAFR in TP53/CDKN2AKO versus control GEJ organoids. (B) Knockdown of PTAFR mRNA by siRNAs in TP53/CDKN2AKO GEJ organoids. (C) Organoids treated with control silencing RNA (siCtrl) and PTAFR silencing RNA (siPTAFR) were photomicrographed under phase-contrast microscopy and collected for (D) Ki67 IF staining. (E) Average organoid size and Ki67 labeling index were quantified, and cell viability was determined by WST-1 assays at indicated time points. *P < 0.05 versus same-day siCtrl. Scale bars, 100 μm. (F to H) TP53/CDKN2AKO GEJ organoids were treated with vehicle control (0.1% DMSO) or a specific PTAFR pharmacologic antagonist, WEB2086, at various concentrations. Average organoid size in bright-field (F) and Ki67 IF images (G) and cell viability (H) were determined by phase-contrast imaging and WST-1 assays, respectively. (G) Ki67 labeling images and quantification (H) were obtained on day 10. Scale bars, 100 μm. Data are represented as means ± SD; n = 4 biological replicates. *P < 0.05 versus Ctrl-DMSO on the same day; †P < 0.05 versus WEB 10 μM on the same day; #P < 0.05 versus WEB 15 μM on the same day by ANOVA.