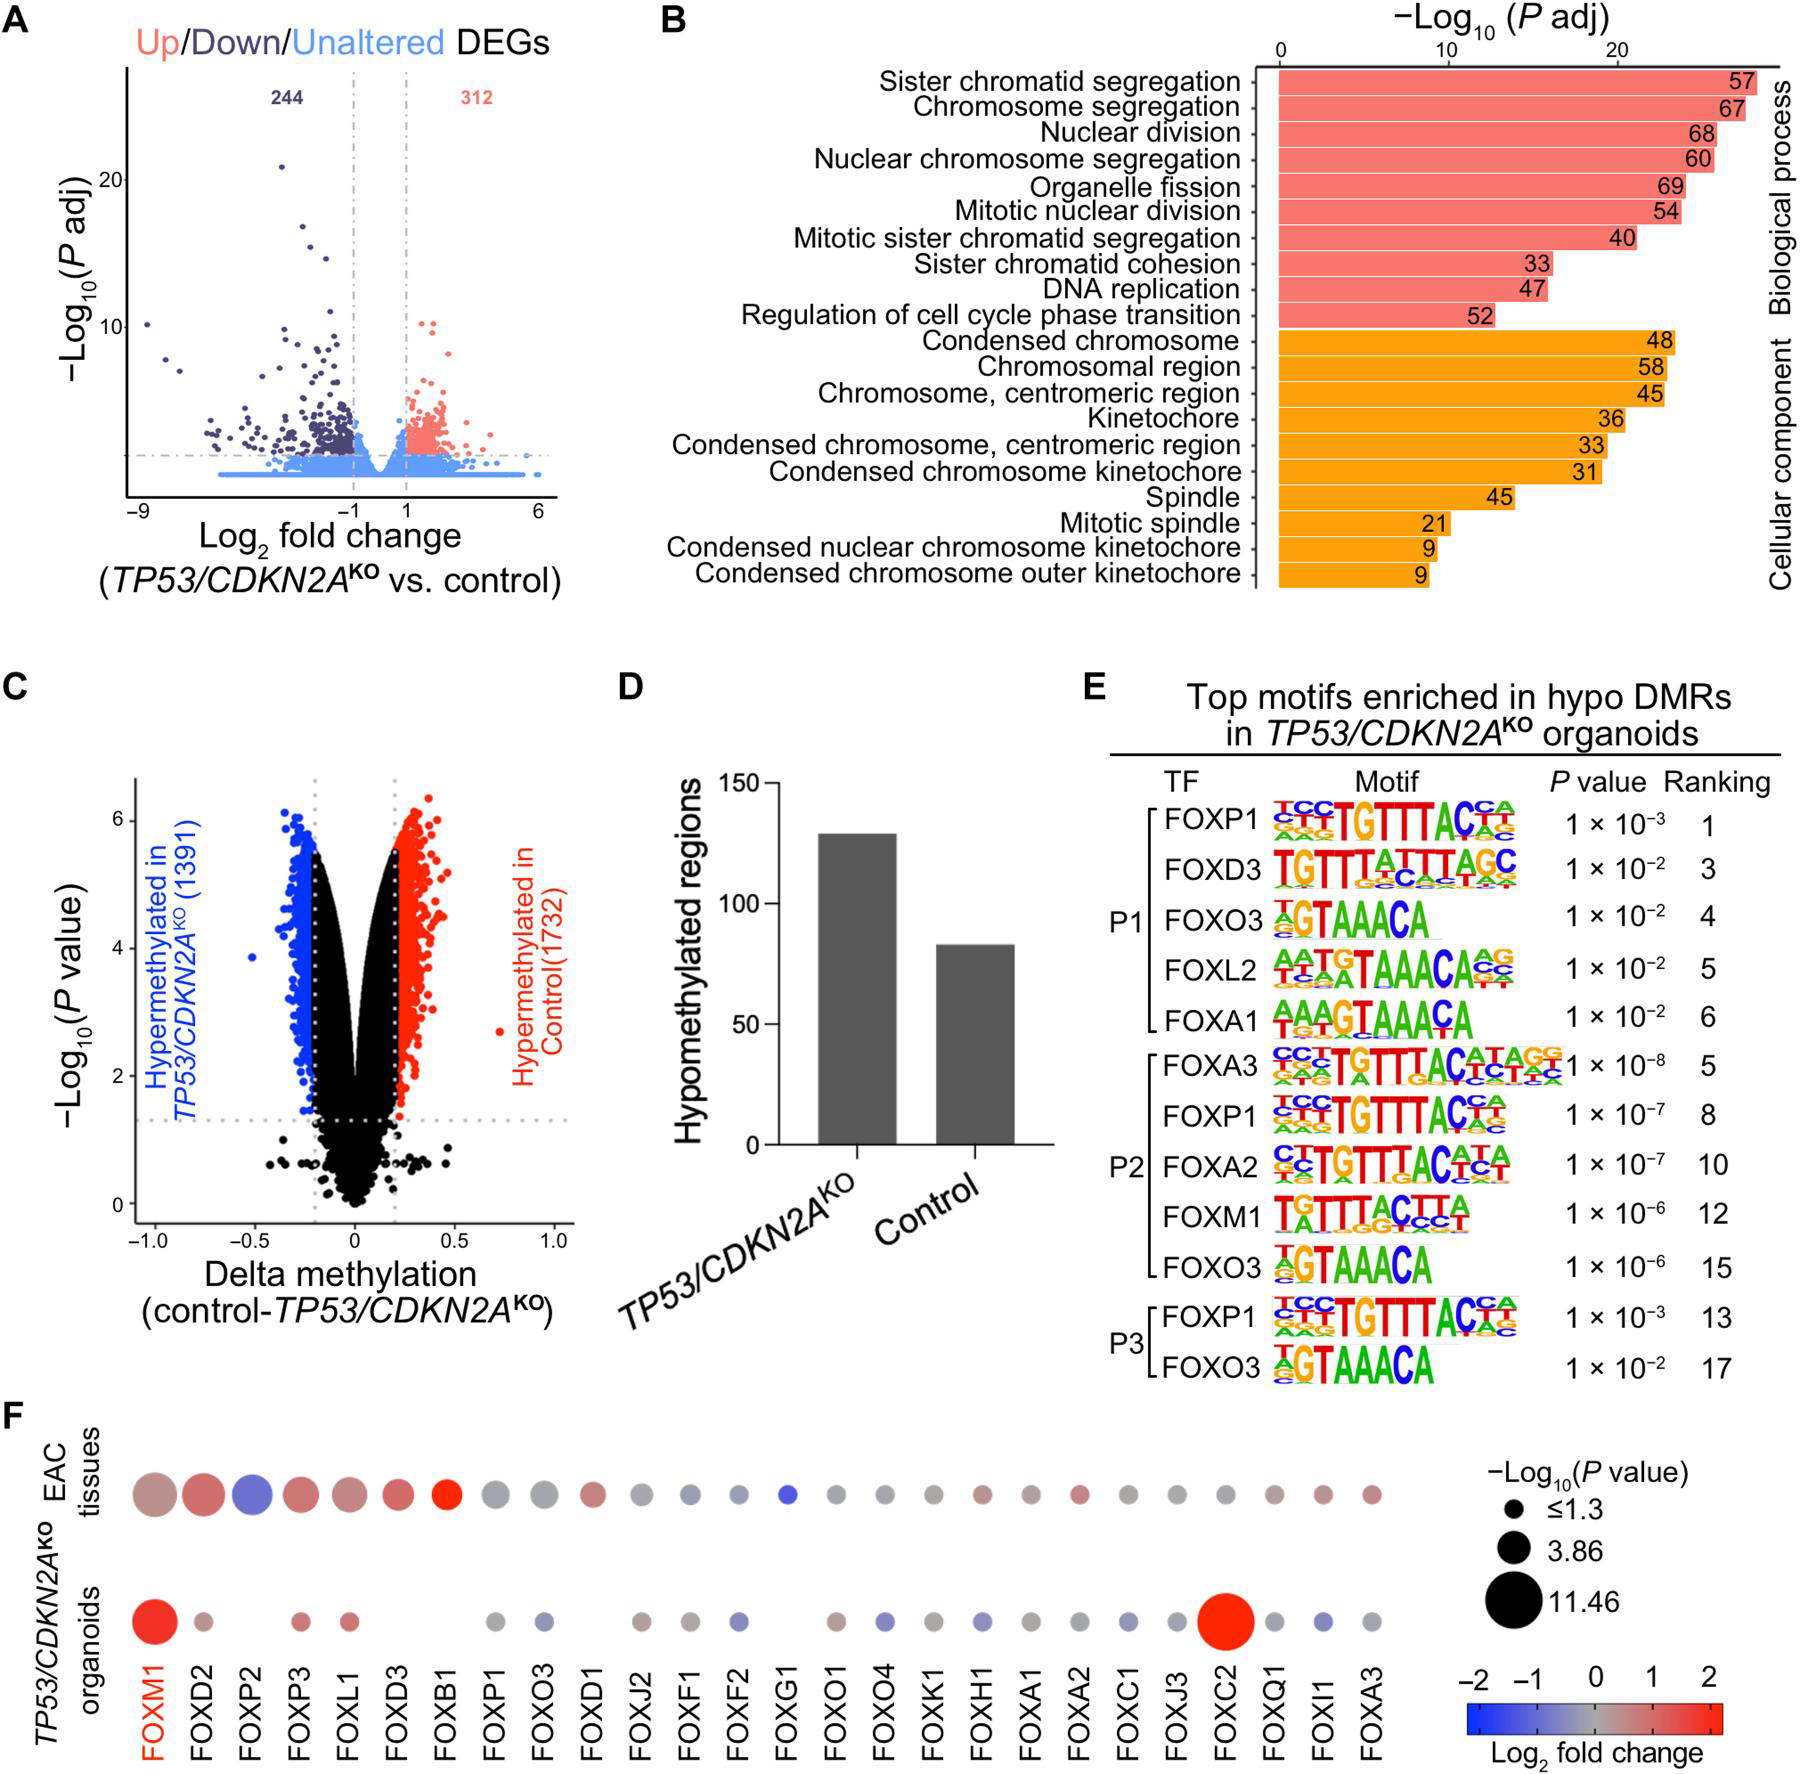
Fig. 6. DNA methylome and transcriptome profiling of TP53/CDKN2AKO GEJ organoids.

(A) A volcano plot showing differentially expressed genes (DEGs) in TP53/CDKN2AKO organoids versus control organoids. Data represent four biological replicates. (B) Gene ontology (GO) analysis identified top ranked key terms of biological processes and cellular components enriched in DEGs in TP53/CDKN2AKO versus control organoids. (C) A volcano plot showing differentially methylated CpGs (red hypermethylated in control and blue hypermethylated in TP53/CDKN2AKO) and (D) column plots showing DMRs in TP53/CDKN2AKO versus control organoids. (E) Top ranked transcription factor (TF) binding motifs from the forkhead box (FOX) family enriched in hypomethylated differentially methylated regions (DMRs) in TP53/CDKN2AKO versus control organoids. P values were calculated using the HOMER package. P1, patient 1; P2, patient 2; P3, patient 3. (F) Dot plots showing expression of FOX family TFs in TP53/CDKN2AKO versus control organoids (bottom dots, n = 4 biological replicates) and in EAC tumors (n = 88) versus normal GEJ samples (n = 9) from the TCGA (top dots). Genes are ranked on the basis of the −log10 (P value) comparing EAC tumors with normal GEJ samples. The dot size denotes −log10 (P value); color indicates log2 fold change; missing dots correspond to undetectable mRNA expressions.
