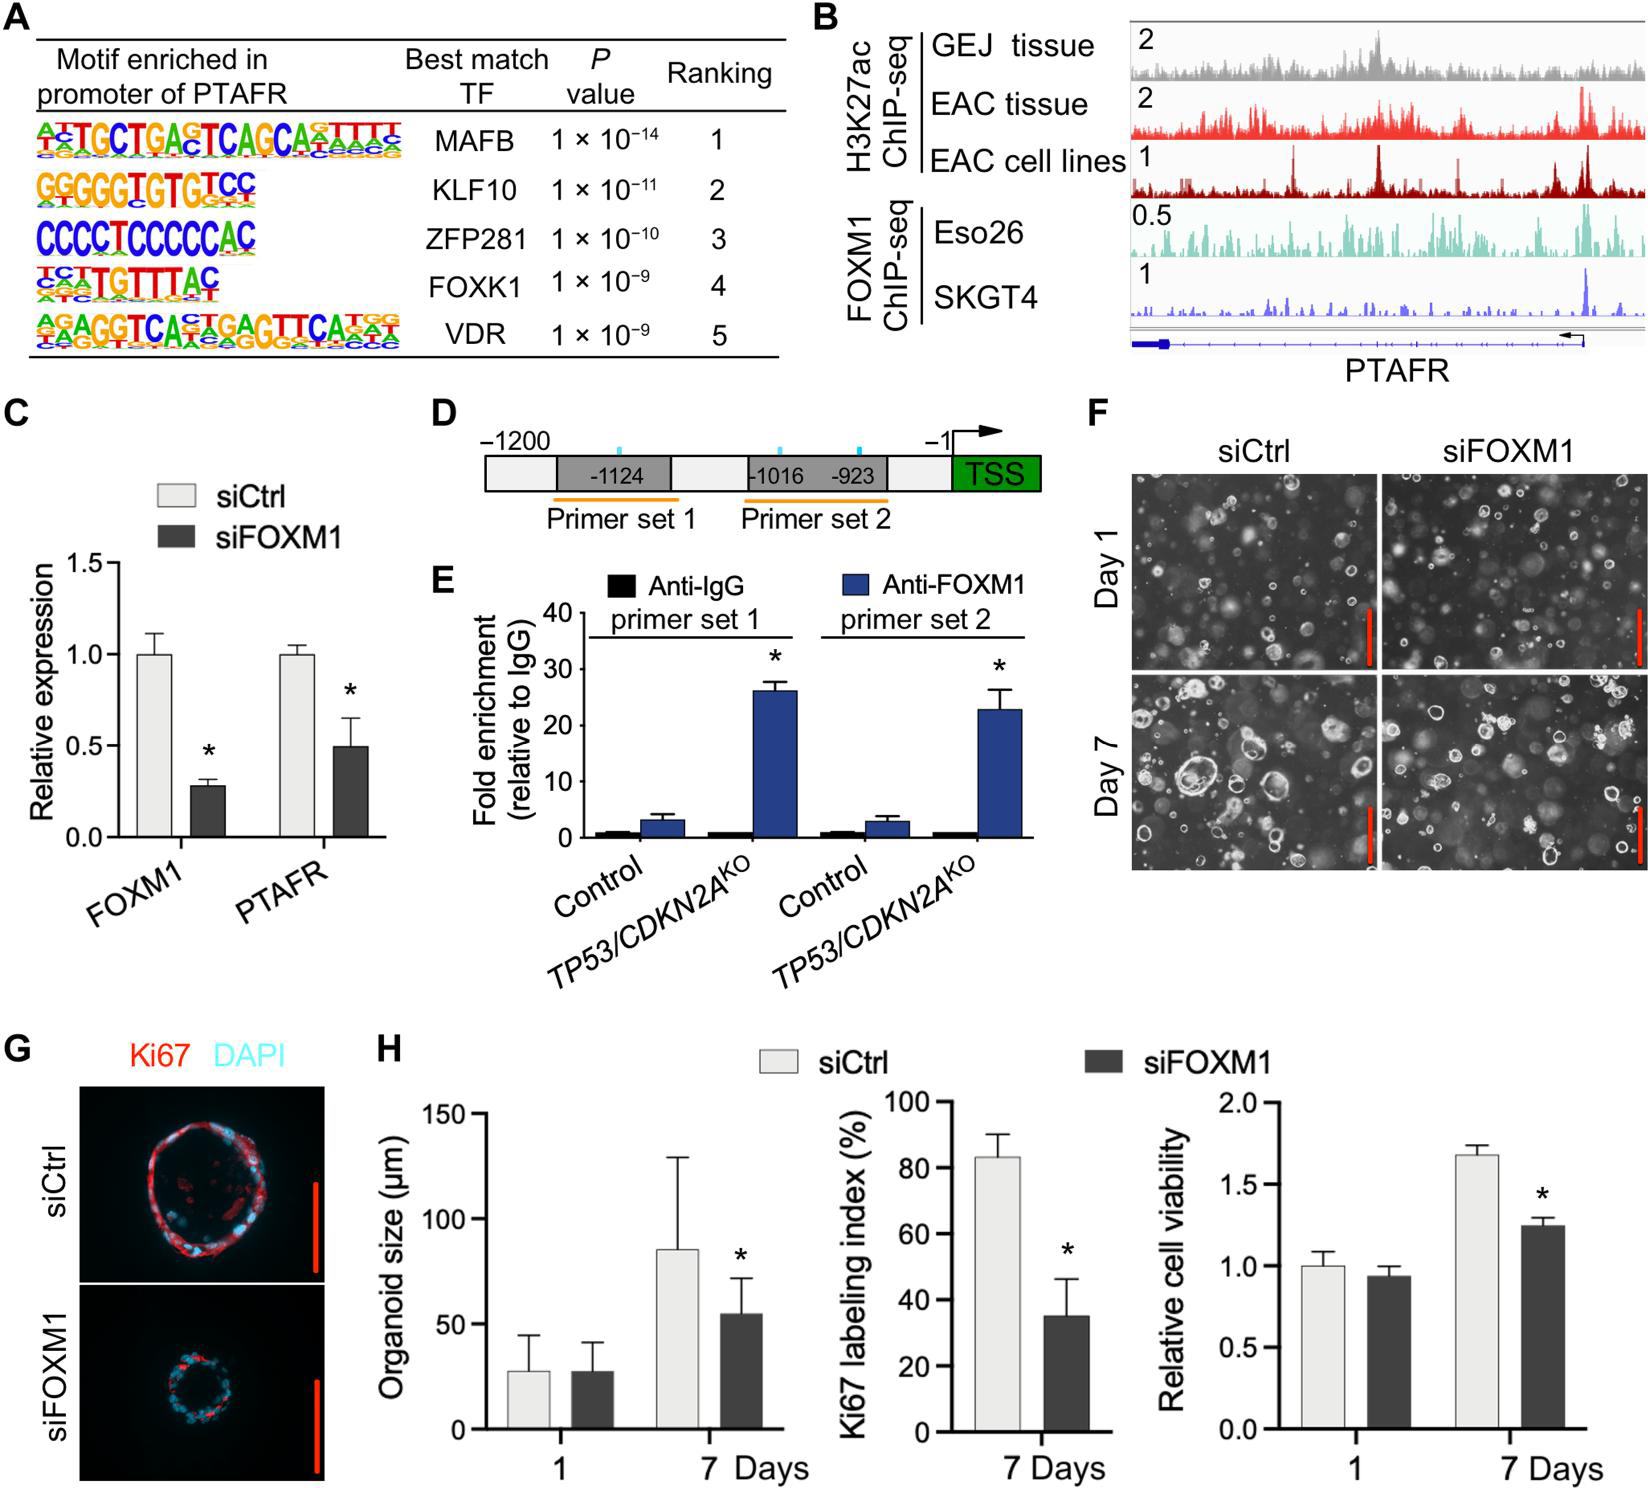
Fig. 7. PTAFR is a direct downstream target of FOXM1.

(A) Motif enrichment analysis of PTAFR promoter region in organoids. (B) ChIP-seq profiles for H3K27ac and FOXM1 at the PTAFR locus in indicated tissues and cell lines. All H3K27ac signals are shown at the same scale. (C) Relative expression of PTAFR mRNA after knockdown of FOXM1 by siRNAs in TP53/CDKN2AKO GEJ organoids. (D) Schematic of PTAFR transcriptional start site (TSS) (green) and upstream sequence. PCR primers for ChIP experiments (orange horizontal lines) and FOXM1 binding motifs (blue vertical lines) are indicated. (E) ChIP-qPCR detection of FOXM1 occupancy at the PTAFR promoter region in organoids using primer sets indicated in (D). ChIP was performed with either anti-FOXM1 or anti-IgG antibodies, and fold enrichment relative to anti-IgG is shown. Data are represented as means ± SD; n = 4 biologic replicates. *P < 0.05 versus control by ANOVA. (F) Organoids treated with siCtrl and siFOXM1 were photomicrographed under phase-contrast microscopy and collected for (G) Ki67 IF staining. (H) Average organoid size and Ki67 labeling index were quantified, and cell viability was determined by WST-1 assay. Scale bars, 100 μm. Data are represented as means ± SD; n = 4 biologic replicates. *P < 0.05 versus siCtrl on the same day by ANOVA.
