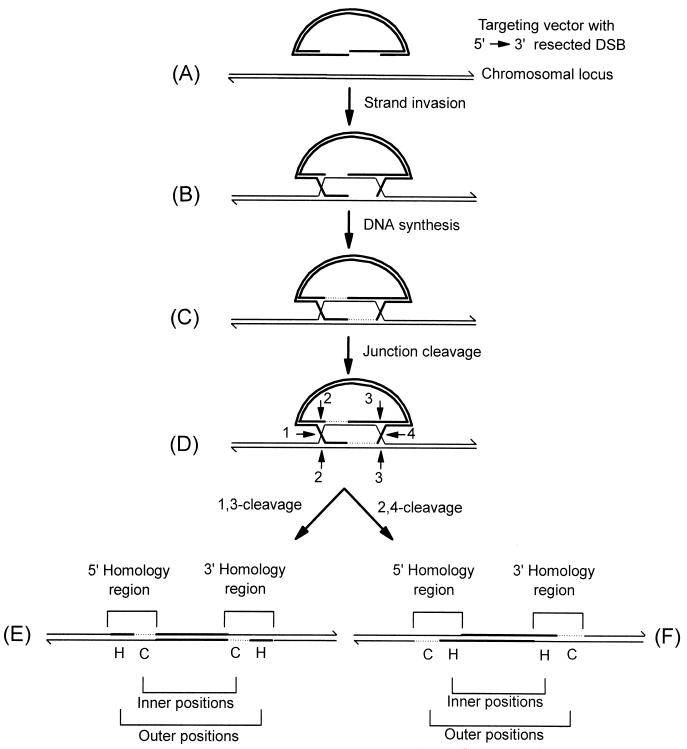
FIG. 1.
DSBR model of recombination. The mechanism of recombination between a linearized DNA transfer vector and the homologous chromosomal locus is depicted. The targeting vector (A) is indicated by thick lines while the homologous chromosomal locus is indicated by thin lines. The 3′ ends of the DNA molecules are indicated by half arrows. After strand invasion (B), regions of newly synthesized chromosomal DNA (C) are represented by thin dotted lines. The numbered positions denoted by arrows indicate potential Holliday junction cleavage sites. Potentially, the joint molecule (D) can be cleaved in two alternate modes, resulting in vector integration into the chromosome. Cleavage at positions 1 and 3 generates the integrated structure shown in panel E, while the 2,4-cleavage mode generates the structure shown in panel F. The structures in panels E and F differ with respect to the position of gene conversion (C) and hDNA (H) tracts in the inner and outer marker positions. For further details, refer to the text.

