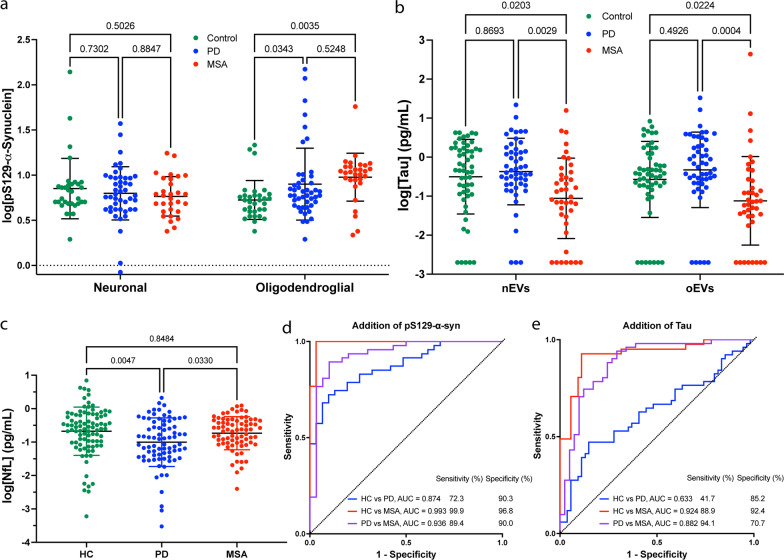
Fig. 1.
Biomarker analysis in HC, PD, and MSA. a, b pS129-α-Syn and Tau concentrations were measured using ECLIA, log-transformed, and analyzed by a mixed-effect analysis with post-hoc Tukey test. Data are represented as mean ± SD. Values below the lower limit of detection were imputed as the minimum value divided by 2. c NfL concentrations were measured using Simoa, log-transformed, and analyzed by a one-way ANOVA with post-hoc Tukey test. Data are represented as mean ± SD. d, e ROC analyses of biomarker concentrations using a multinomial logistic regression model with LASSO variable selection (Additional file 1: Fig. S3). The model included nEV α-syn concentration, oEV:nEV α-syn concentration ratio, total EV concentration in the sample and d oEV pS129-α-syn or e oEV tau concentration. The presented models do not include NfL

