
Fig. 8.
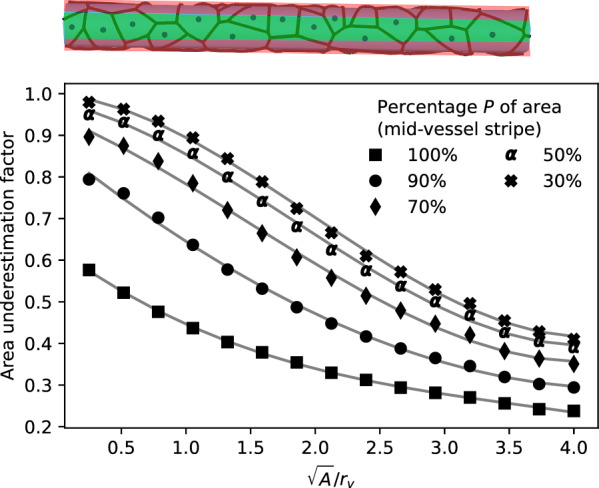
Evaluation of the image analysis error when estimating endfoot areas from 2D images. An example of the region of interest for one particular realization is shown in the top image. means all polygons in the image have been counted. means only the polygons centered in the stripe of thickness in the middle of the vessel between the vessel outlines have been considered in the analysis. The top image shows applied to the sample of Fig. 1 and the counted polygons are marked with a dot in their centroid. Counting all polygons leads to the most severe underestimation. The practice of discarding polygons close to the border reduces the error of the image analysis (underestimation fraction closer to 1). Solid lines are least squares curve fits with cubic polynomials