Fig. 1.
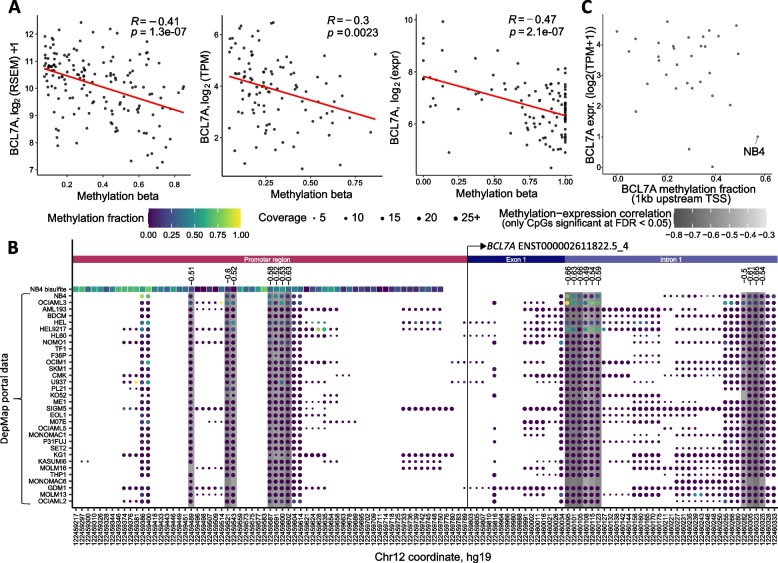
BCL7A methylation and expression status in AML patients and cell lines. a Significant inverse correlation (Pearson’s correlation coefficient) between methylation and expression of BCL7A in TCGA-LAML cohort, TARGET-AML and Glass et al. Methylation is expressed as the beta-value of the Illumina HM450 probe (TCGA, TARGET) or genomic position (Glass et al.) most inversely correlated with gene expression. b CpG methylation profile around the transcription start site (TSS) of BCL7A in AML cell lines. Methylation fraction measured by reduced representation bisulfite sequencing data from DepMap Portal (https://depmap.org/portal/) is shown along with our bisulfite sequencing data of the NB4 cell line (top row). CpGs significantly correlated with expression (FDR < 0.05) are highlighted under grey background and their Pearson’s correlation coefficient is shown above. The TSS of BCL7A is indicated by a vertical line. c Methylation fraction 1 kb upstream of the BCL7A TSS and gene expression in 32 AML cell lines from DepMap Portal. NB4 shows the highest methylation level as well as low BCL7A expression

