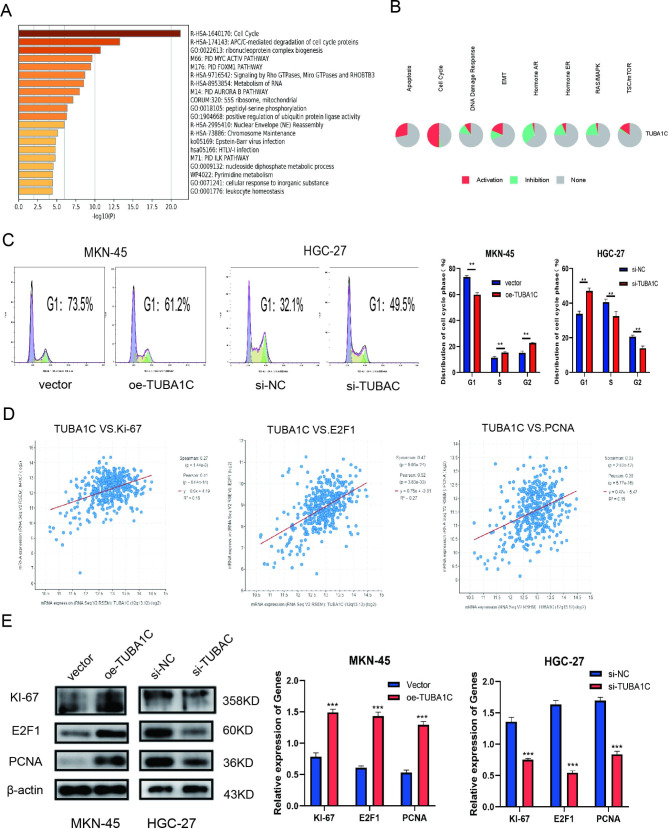
Fig. 4.
Bioinformatics prediction and experimental verification of TUBA1C. A Functional pathway analysis of TUBA1C was performed using matescape enrichment analysis. B Pathway activity of the TUBA from GSCA. C Cell cycle was determined in MKN-45 and HGC-27 cells transfected D Co-expression of TUBA1C with KI67, E2F1 and PCNA in GC were analyzed in cBioPortal using the TCGA database. E The expression of KI-67, E2F1 and PCNA in MKN-45 cells transfected with oe-TUBA1C and its control and HGC-27 cells transfected with si-TUBA1C and its control were detected by Western blotting. (The blots were cut prior to hybridisation with antibodies.) Data are mean ± SD. (Student’s t test **P < 0.01, ***P < 0.001 )

