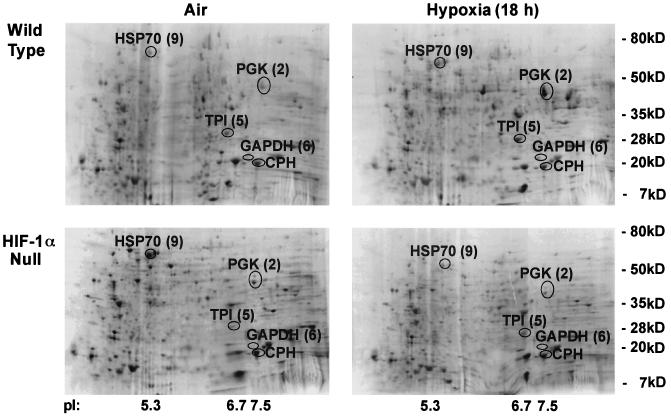
FIG. 9.
Two-dimensional gel autoradiographs indicate that the majority of differences in the HIF-1α proteome can be identified as glycolytic enzymes. Representative autoradiographs of two-dimensional SDS-PAGE gradient gels are presented showing labeled total protein from wild-type and HIF-1α-null mEFs exposed to 18 h of hypoxia (pO2 ≤ 0.01%, relative to air at a pO2 of ∼21%). Cells were labeled under aerobic or anaerobic conditions for 1 h (35S-labeled cysteine and methionine at 100 μCi/ml, 37°C). Spots are labeled with both the original identification number and their protein assignment by mass spectrometric analysis. CPH, cyclophilin (unchanged); HSP70, heat shock protein 70 (unchanged); PGK, induced in wild-type cells only; TPI, induced in wild-type cells only; GAPDH, induced in wild-type cells only.

