
Figure 1. TRF uniquely affects gene expression across tissues.
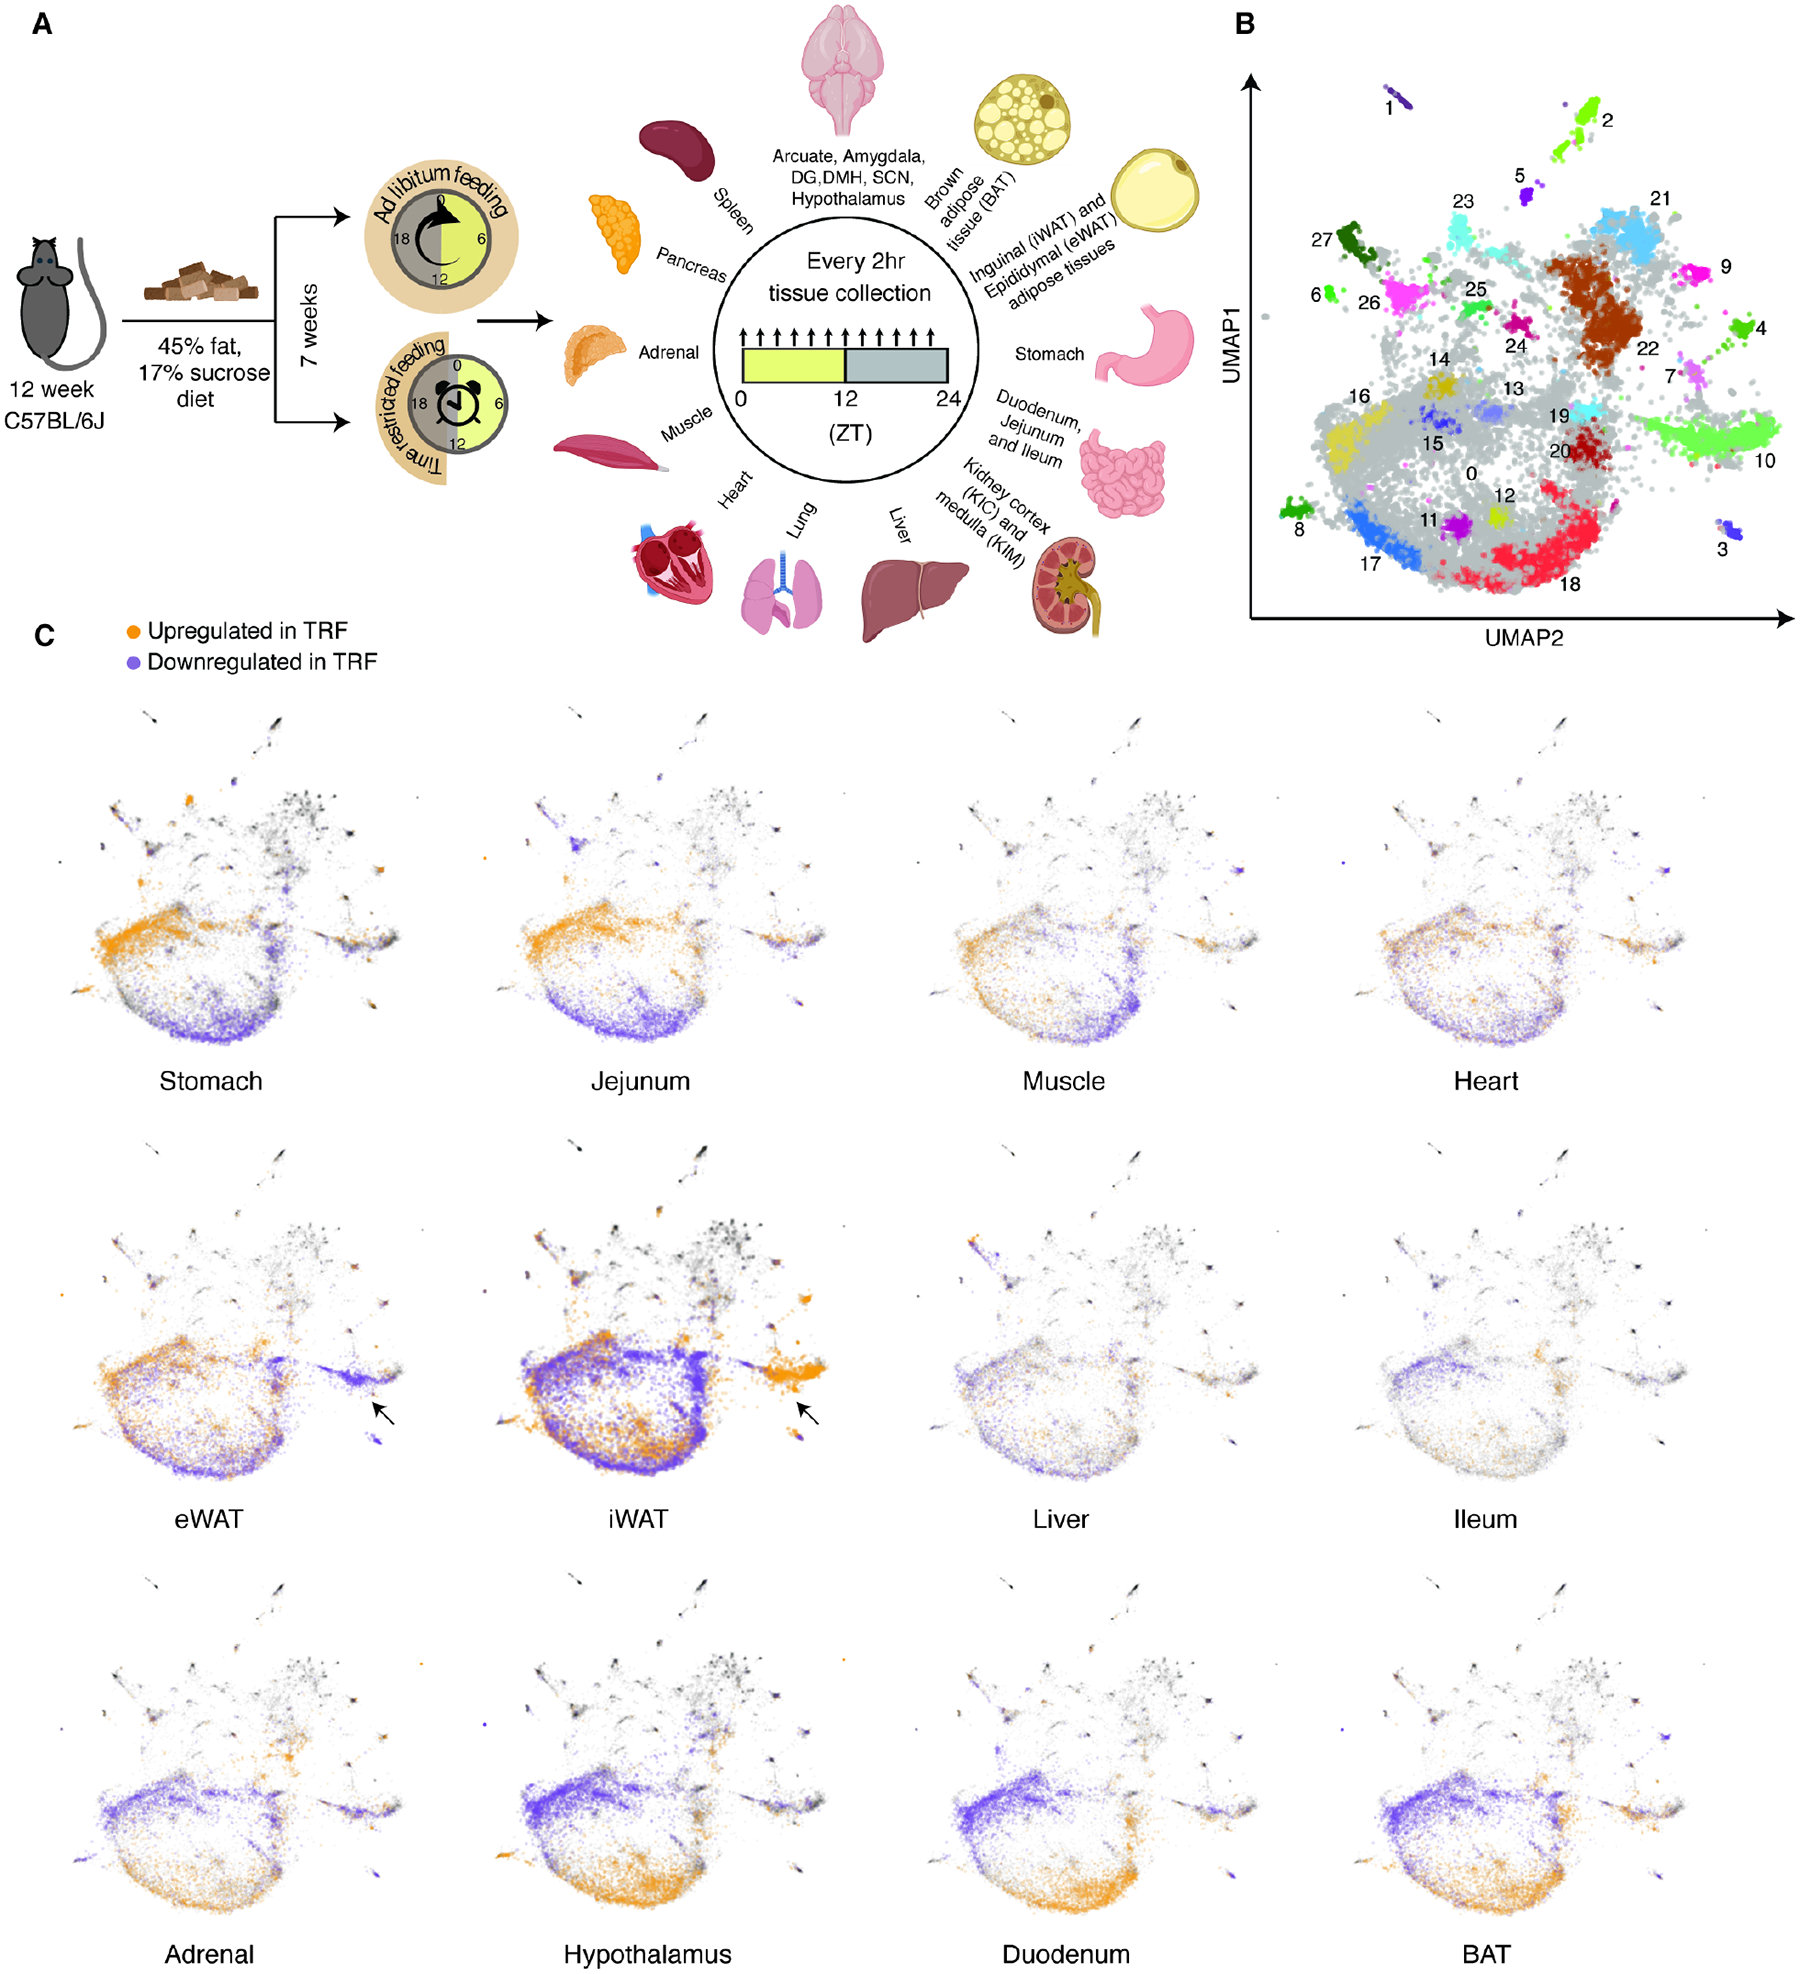
(A) Schematic diagram indicating the experimental setup for time-restricted feeding (TRF) intervention and sample collection strategy, along with a list of 22 collected tissues. Created with BioRender.com. (B) UMAP coordinates of 21,717 genes from 1035 samples clustered by similarity of normalized gene expression per tissue. The UMAP is divided into 27 clusters based on transcription effects and each cluster shown in a different color. (C) Genes significantly upregulated or downregulated by TRF in each tissue are mapped on top of the UMAP projection. Black arrow indicates the Cluster 10 genes corresponding to immune cell regulation that are oppositely regulated in eWAT and iWAT. See also Figure S1 and tables S1 and S2.