
Figure 6. TRF affects the peak phases of clock gene expression across tissues.
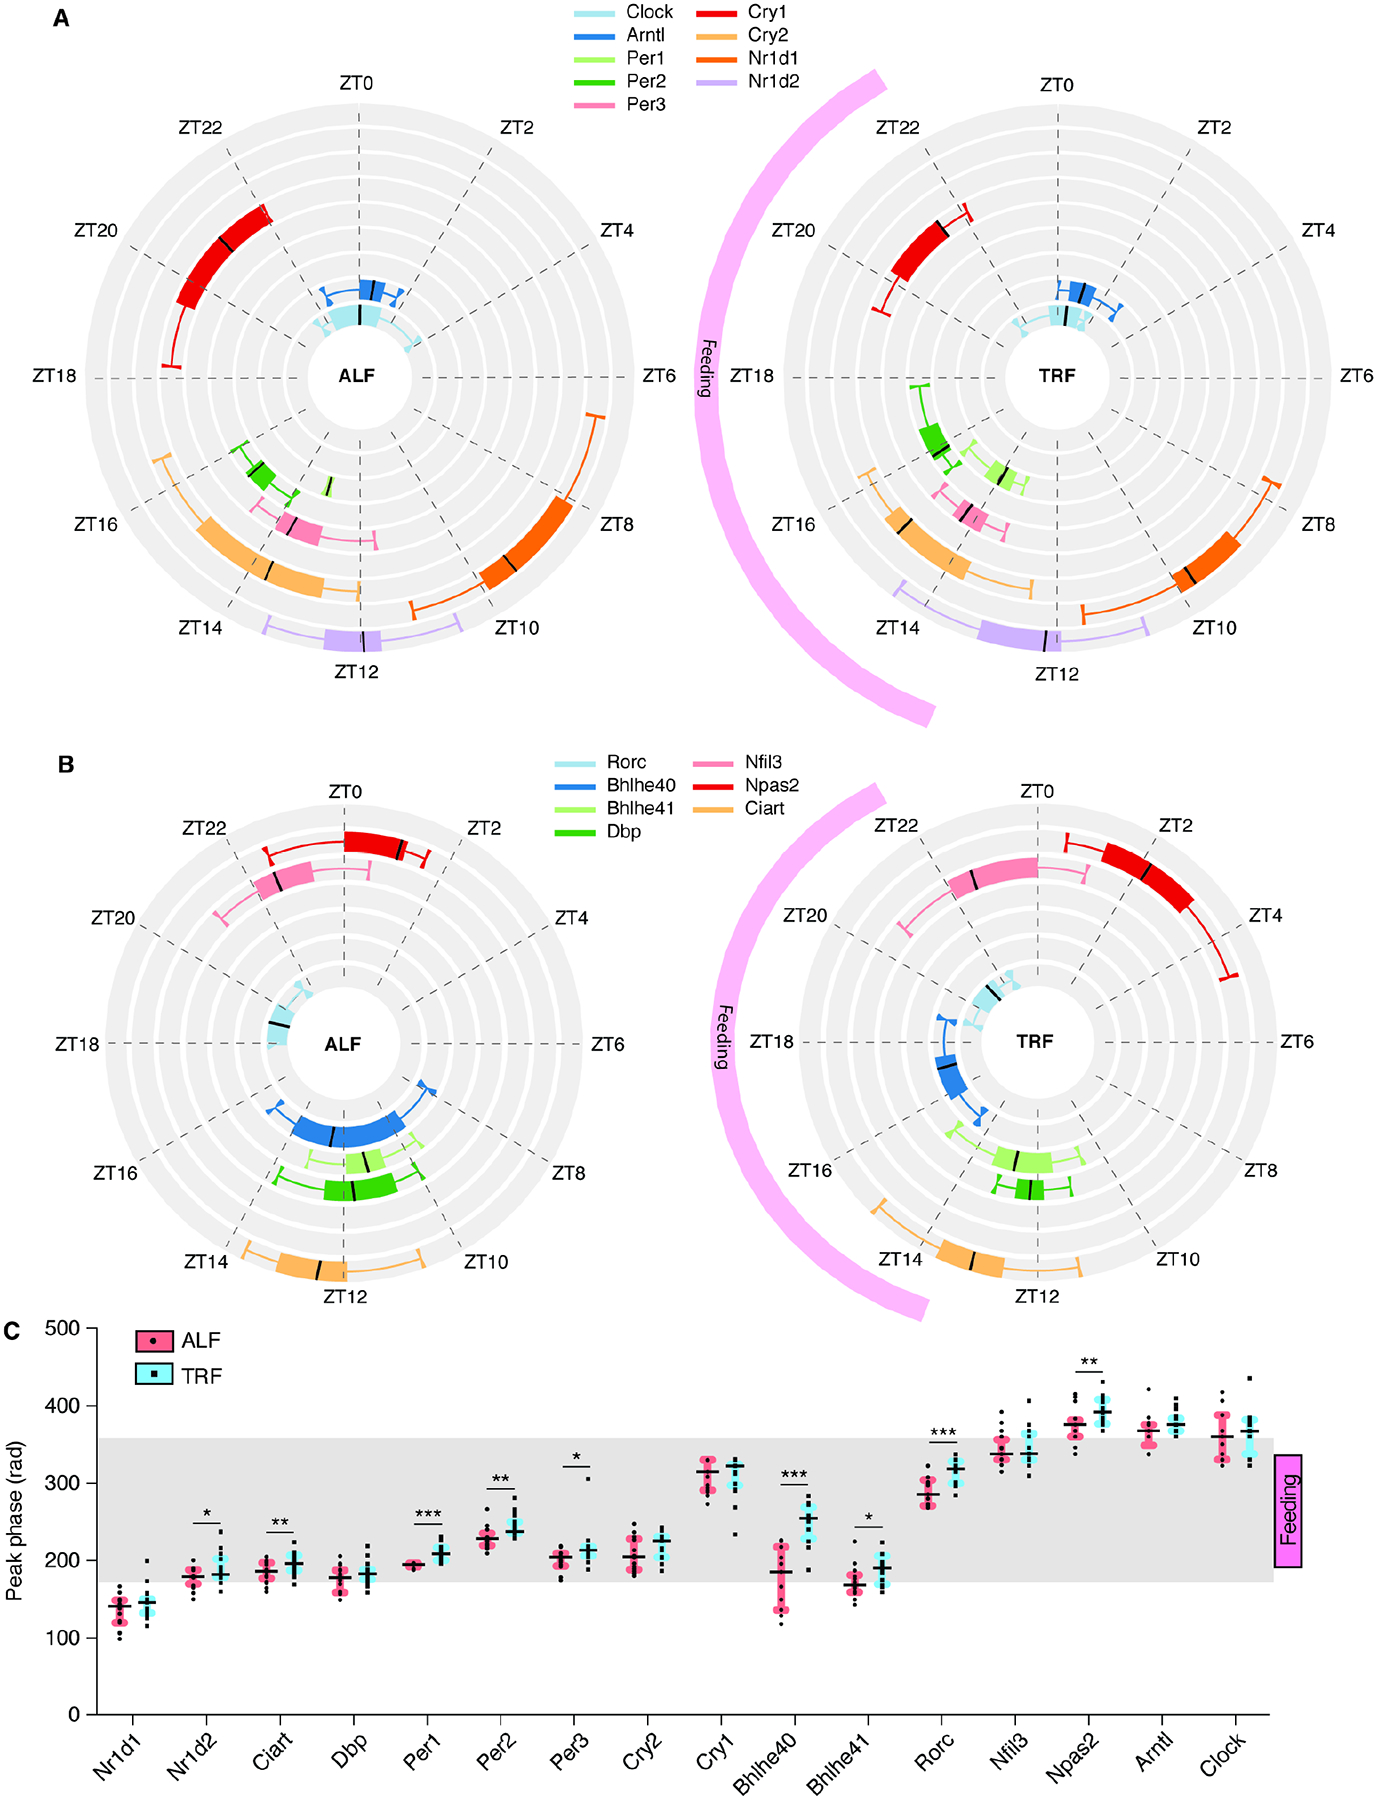
(A-B) Circular box plots indicate the distribution of peak phases of core clock genes (A) and ancillary clock genes (B) in tissues where they are detected as cycling in ALF (left) or TRF (right). The black line indicates the median. Upper and lower boxes indicate Q1 and Q3. Whiskers indicate 1.5 X IQR. The TRF feeding window from ZT13-ZT22 is indicated. (C) Changes in peak phase of expression (in radian) of clock genes in the tissues where they are detected as cycling in ALF or TRF (except SCN). TRF feeding window from ZT13-ZT22 and light-dark cycle are indicated. Statistics: (C) The black line indicates the median. Upper and lower boxes indicate Q1 and Q3, with *p < 0.05, **p < 0.01, ***p < 0.001 using multiple t-test comparison. See also Table S6.