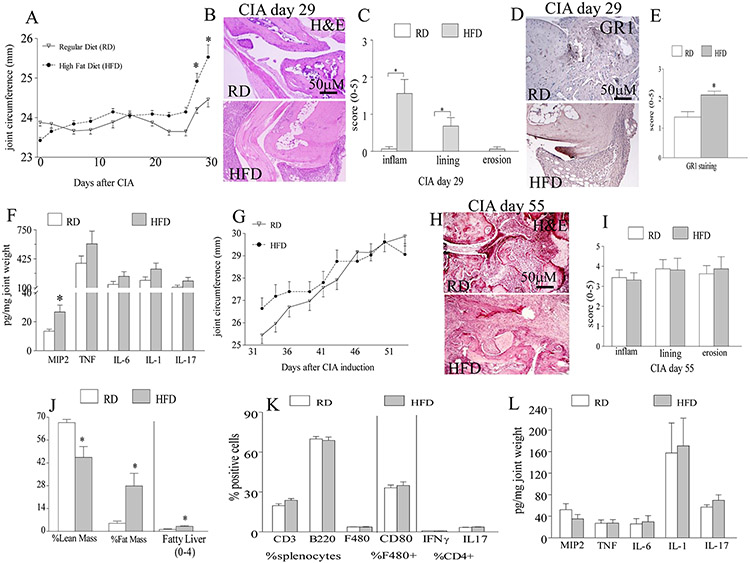
Figure 1. Obesity impacts CIA onset but not active phase by enhancing joint MIP2 induced neutrophil migration.
A. Joint circumference were calculated in CIA mice that were fed on regular diet (RD) (n=13 mice) or 60% high fat diet (HFD) (n=12 mice) for 8 weeks. B. CIA ankles harvested on day 29 from mice fed on RD and HFD were H&E stained (orig. mag. x 200), and C. inflammation (inflam), lining thickness (lining) and bone erosion (erosion) were quantified on a 0-5 scale, n=5 mice, 10 back paws. Synovial tissues (STs) obtained from the back paws of day 29 CIA mice fed on RD and HFD were stained with anti-GR1 antibody (orig. mag. x 200) (D) and GR1 staining was quantified on a 0-5 scale, (E) n=8. F. Joint MIP2, TNF, IL-6, IL-1 and IL-17 protein levels were assessed by ELISA from the front (carpal joints) and back paws of day 29 CIA mice fed on RD and HFD and normalized by joint weight, n=8. G. Joint circumference is shown from day 31 to day 55 in CIA mice that were fed on RD or HFD for up to 12 weeks, n=12-13 mice. H. CIA ankles harvested on day 55 from mice fed on RD and HFD were H&E stained (orig. mag. x 200), and I. inflammation, lining thickness and bone erosion were quantified on a 0-5 scale, n=8. J. % lean and fat mass or H&E staining of liver samples from day 55 CIA mice on RD and HFD were measured by dual-energy x-ray absorptiometry (DXA) or scored for fatty liver on a 0-4 scale, n=12-13. K. The frequency of CD3, B220, F480, F480+CD80+ as well as TH1 and TH17 cells was assessed in splenocytes harvested on day 55 from CIA mice fed on RD and HFD, n=7. L. Changes in joint MIP2, TNF, IL-6, IL-1 and IL-17 were determined by ELISA from day 55 CIA mice fed on RD and HFD, n=7. Values are mean ± SE. * indicates p<0.05.

