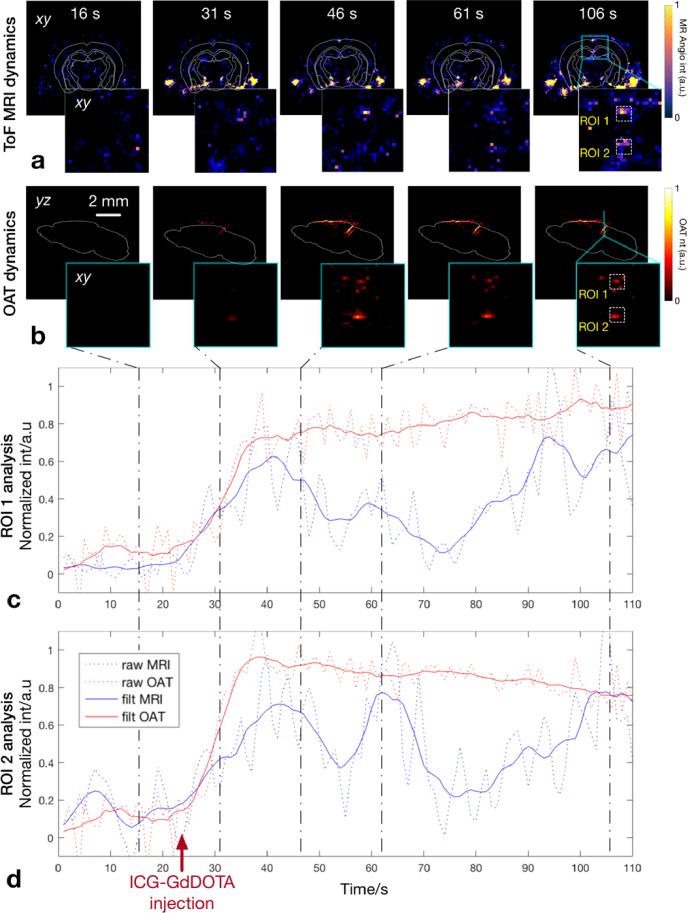
Fig. 4.
The hybrid MROT system visualizes perfusion of two contrast agents simultaneously injected at t = 23 s (indicated with a red arrow). (a) The recorded ToF MRI images sequence showing contrast enhancement by GdDOTA. (b) The corresponding time-lapse OAT images showing the increasing concentration of ICG. The dynamic ToF MRI and OAT images at 16, 31, 46, 61, 106 second time points are captured and displayed in parallel. (c, d) The time courses of OAT (red) and MRI (blue) signal intensity are plotted in two ROIs, as indicated in (a) and (b). (See Visualization 1 (2.1MB, mov) and Visualization 2 (2.2MB, mov) )

