. 2023 Mar 3;37(2):924–932. doi: 10.21873/invivo.13164

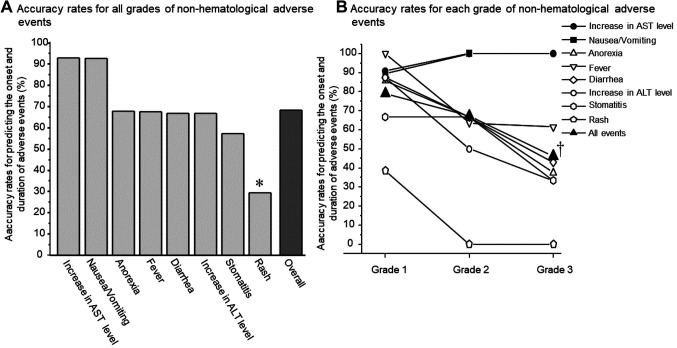
Figure 2. Comparison of the accuracy rates for predicting the onset and duration of various non-hematological adverse events. The accuracy rate was compared for each adverse event of any grade (A) and for the different adverse event grades (B). In (A), the accuracy rate for rashes was significantly lower than that for increased AST levels and nausea/vomiting. AST: Αspartate aminotransferase; ALT: alanine aminotransferase. *p<0.05 using the Kruskal-Wallis test followed by Scheffe’s test. In (B), significant differences in the accuracy rate were found according to the grade of the total adverse events. p<0.01 vs. Grade 1 using the Kruskal-Wallis test followed by Scheffe’s test. However, the accuracy rate was not significantly different among the grades of individual adverse events.

Figure 2