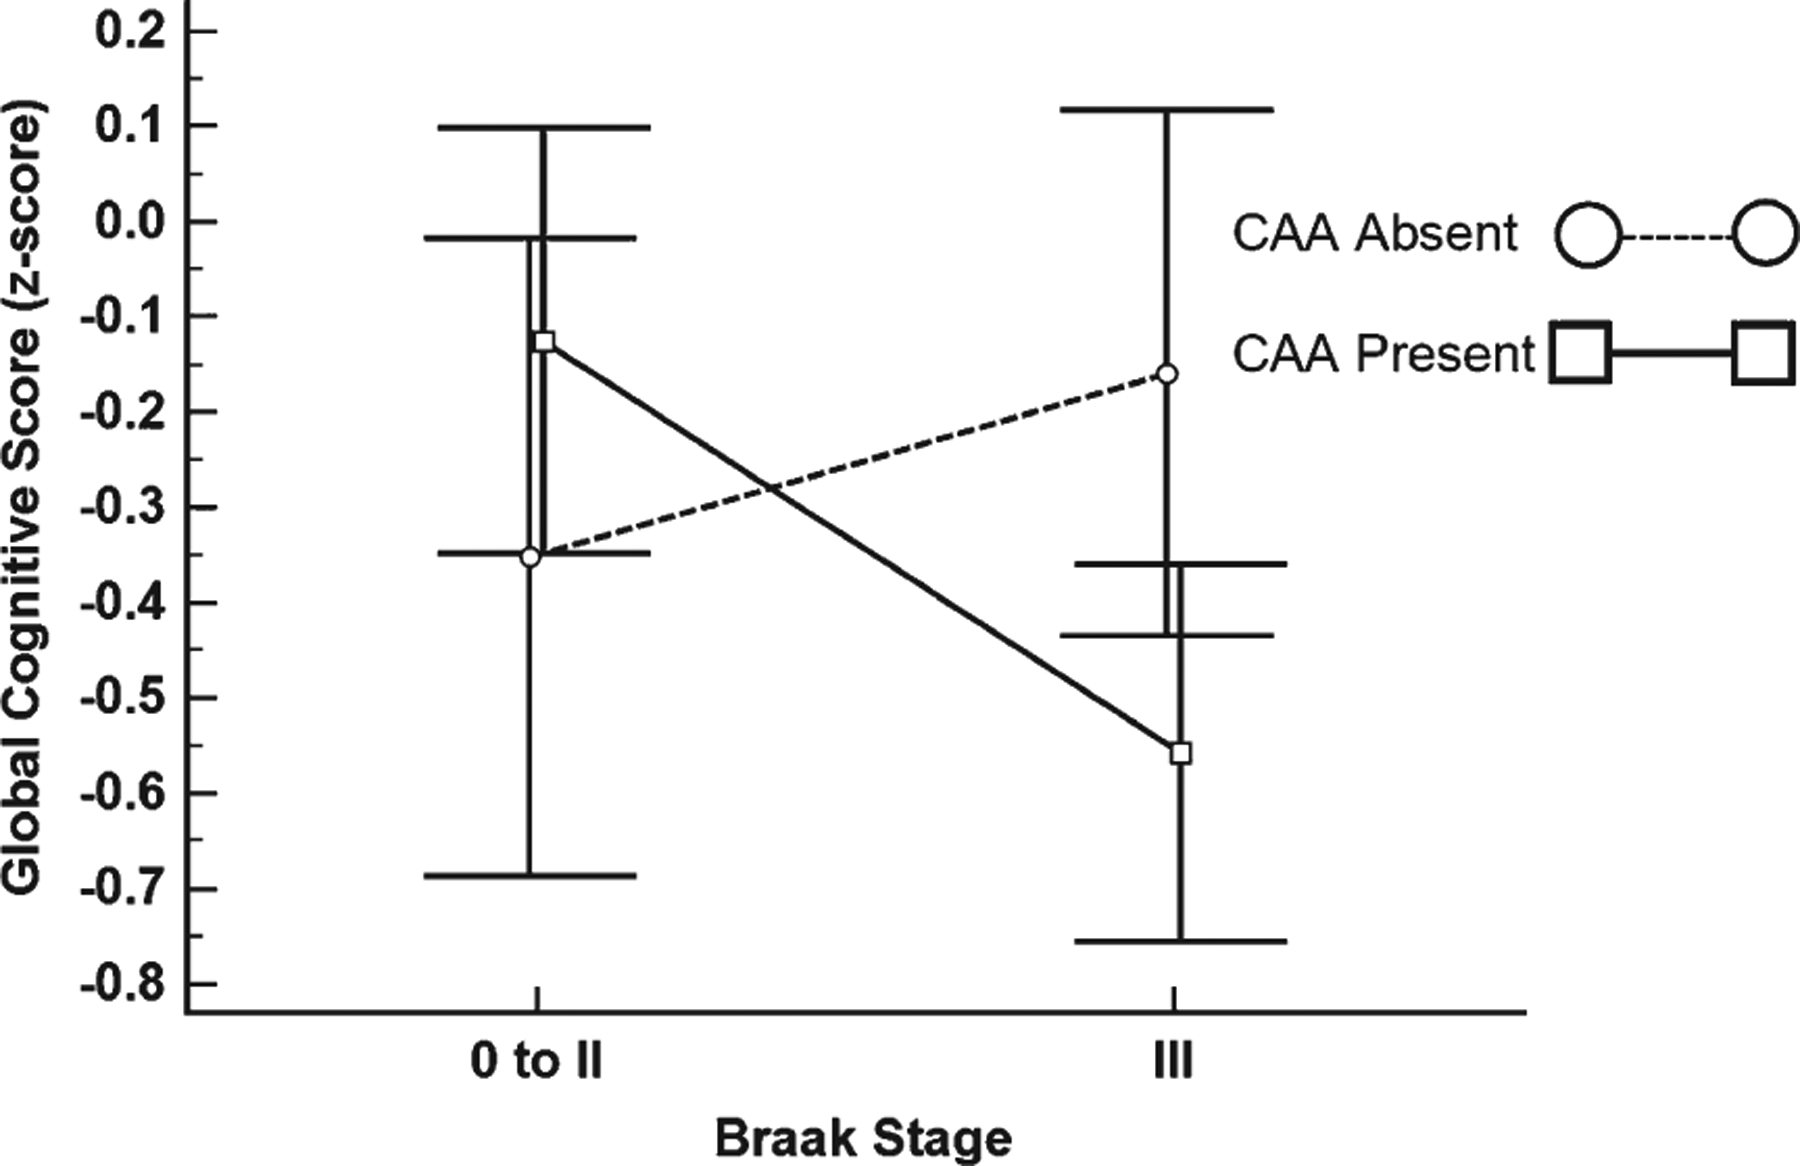
Fig. 2.

CAA-dependent global cognitive score differences for braak stage 0 to II and III. Global cognitive score stratified by Braak stage and CAA status. Squares and circles represent the mean and error bars are 95% confidence intervals. Dashed line represents the CAA Absent group and the solid line represents the CAA Present group.
