Figure 5.

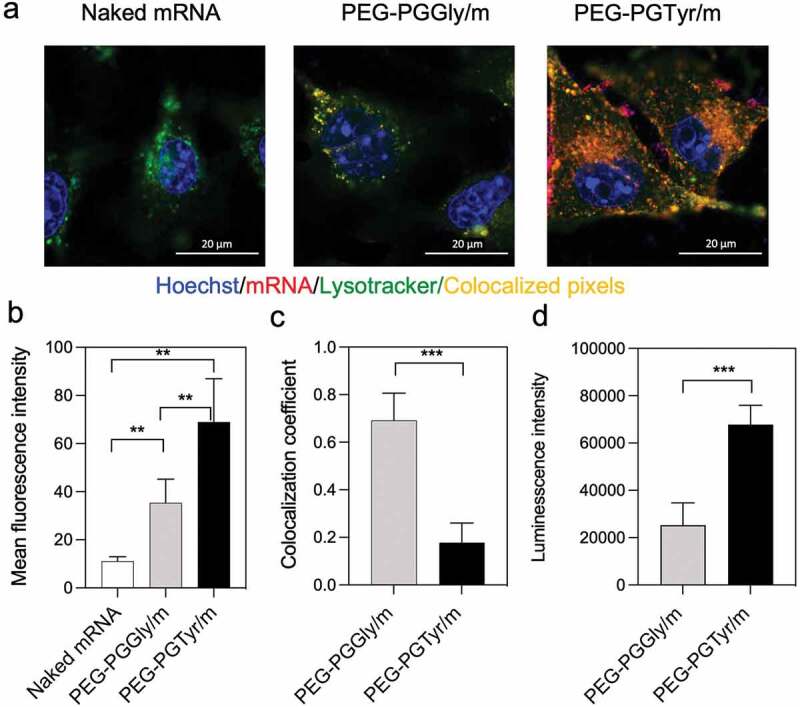
In vitro delivery of mRNA-loaded micelles. (a) Representative CLSM images of HuH7 cells incubated with micelles for 8 h (scale bar = 20 μm; Blue: Hoechst; Red: Cy5-labeled mRNA; Green: Lysotracker; yellow: colocalization of mRNA and Lysotracker). (b) Cellular uptake quantified by the mean fluorescence intensity of Red channel from 20 cells in each sample. Data are presented as the mean ± S.D. (n = 20). (c) Colocalization coefficients of Red-Green channels quantified from 10 cells in each sample. Data are presented as the mean ± S.D. (n = 10). (d) Transfection in HuH7 cells after 24 h treatment with micelles encapsulating GLuc mRNA. Data are presented as the mean ± S.D. (n = 4). Statistical significance was conducted using one-way ANOVA and Tukey’s post hoc tests (b) and two-tailed Student’s t-test (c,d). The difference was considered statistically significant with **p < 0.01, ***p < 0.001, denoted with asterisks.
